DAX Pre-Market Reference Candle — Breakout Behaviour After Cash Open
Data basis: DAX index M5 / M1 / tick (bank broker, bid-aggregated), Jan 2018 – Feb 2026, 2,070 trading days (98.5% of all days). A purely statistical study — no trading recommendation, no return promise. Trading leveraged products can lead to total loss.
What this is about
The reference candle (R) is the 10-minute candle from 08:50–09:00 Berlin time — the last ten minutes before the XETRA open. It defines R-High, R-Low and the R-Range = R-High − R-Low. A move of 1R equals the size of that candle; this normalisation makes all price levels comparable.
The first break is the first tick from 09:00 that crosses an R edge. This study asks, purely descriptively: how far, how fast and how reliably does this morning move run — across 8 years and every market regime?
Methodology (short)
The measured move ends as soon as one of two events occurs first:
- the first opposing candle (5-min, close against the break direction), or
- price touches the opposite R edge — equivalent to a stop-loss of 1R.
The measured distance is therefore the maximum favourable excursion before a stop-out. Analysis is purely descriptive (quantiles, hit rates), complemented by chi-square tests and Cohen's h for the key comparisons. No parameter optimisation, no machine learning.
Question 1a — How far does price break out?
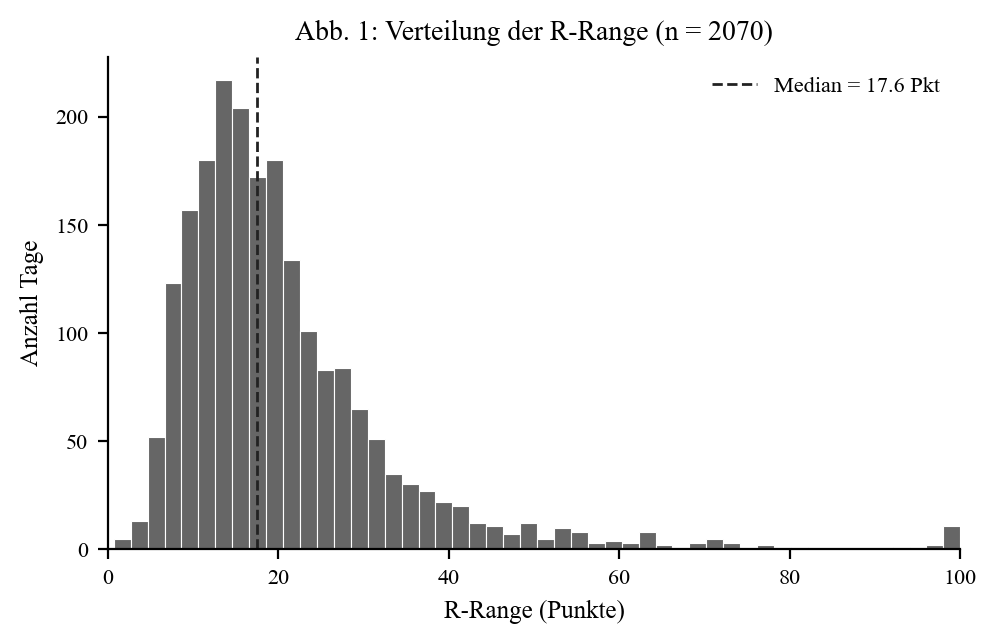
The reference candle is ~18 points at the median (Q25 12.5 · Q75 24.9). So 1R is roughly 18 points.
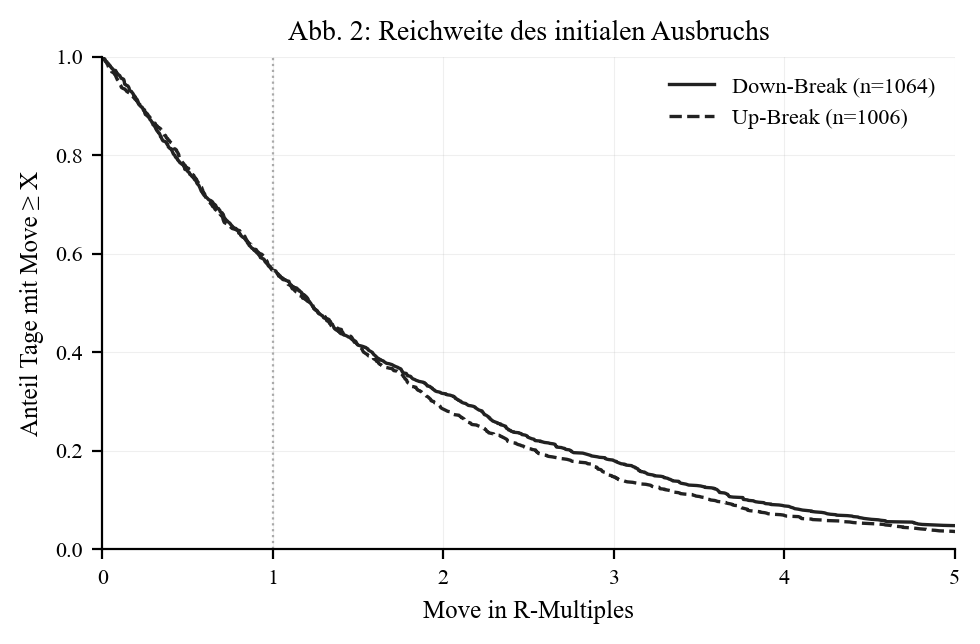
| R threshold | Hit rate |
|---|---|
| ≥ 0.5R | 77.1% |
| ≥ 1.0R | 56.8% |
| ≥ 1.5R | 41.5% |
| ≥ 2.0R | 30.1% |
| ≥ 3.0R | 16.5% |
| ≥ 5.0R | 4.3% |
| ≥ 10R | 0.5% |
On 56.8% of days the move reaches at least 1R (median 1.22 R), on 30.1% even 2R. On 37.2% of days price instead runs back and touches the opposite side (stop-loss) before 1R is reached. Up and down breaks behave almost identically.
Question 1b — Is the reversal worth trading?
When the first break fails (< 1R) and price comes back — is it then worth trading the other side?
| Metric | Value |
|---|---|
| Share of failed breaks (< 1R) | 43.2% |
| of those: opposite side breaks | 94.0% |
| counter-move ≥ 1R (of all days) | 18.7% |
| median counter-move | 0.9 R |
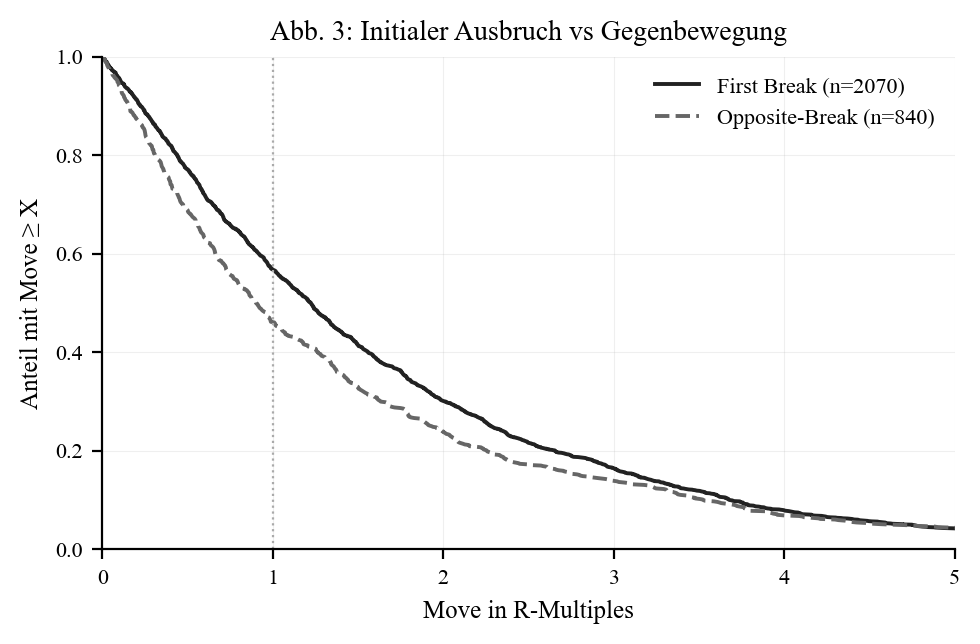
The opposite side almost always breaks (94%) after a failed break — but the counter-move is much weaker at a median of 0.9 R versus 1.22 R for the first break. Across all days the reversal delivers a 1R move on only 18.7% of days (vs. 56.8% for the first break). The initial breakout is clearly superior.
Question 2 — How important is timing?
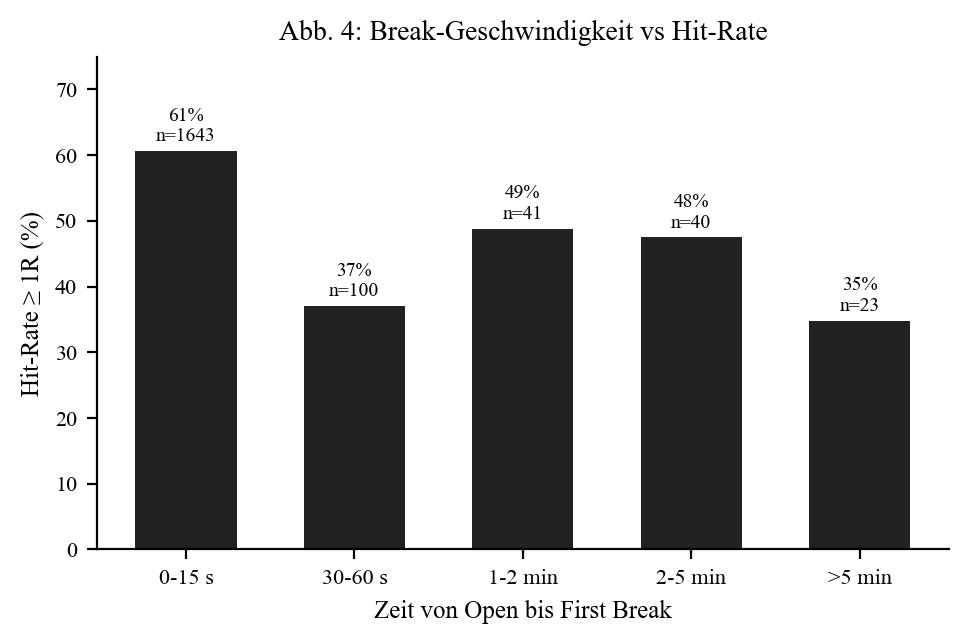
On ~89% of days the break happens immediately (≤ 15 s after the open). Those instant breaks show the highest hit rate at 60.6%; later breaks are consistently lower.
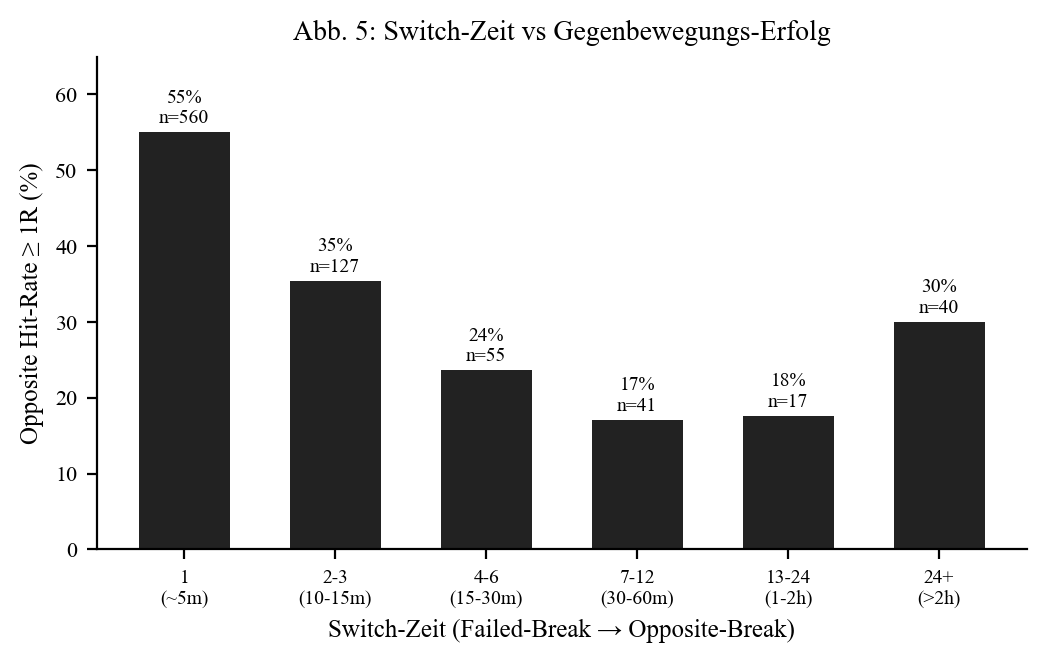
For the reversal, switch time is the dominant factor:
| Switch time | Hit ≥ 1R |
|---|---|
| 1 bar (~5 min) | 55.0% |
| 2–3 bars (10–15 min) | 35.4% |
| 4–6 bars (15–30 min) | 23.6% |
| 7–12 bars (30–60 min) | 17.1% |
| 24+ bars (> 2 h) | 30.0% |
When the counter-break is immediate (1 bar) the hit rate is 55%; at medium delay it collapses to ~20%. This is the strongest single effect in the whole study (Cohen's h = 0.72). A reversal is only worth trading if it comes practically at once.
Question 3 — Does an offset entry help?
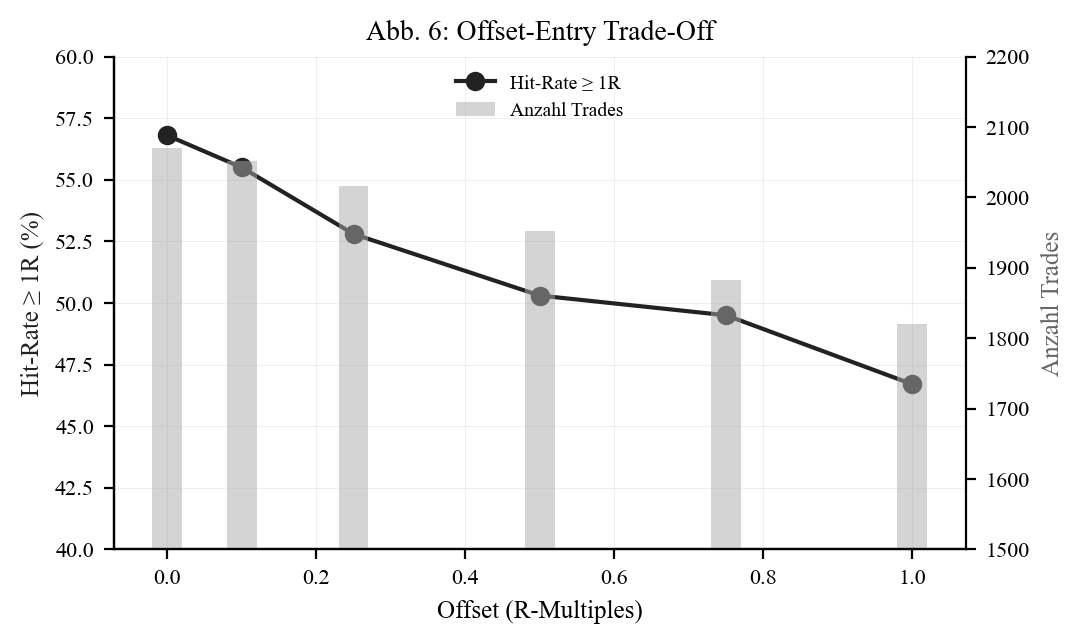
Instead of entering immediately at the R edge, you could wait until price has already run X R further. The move distance is then measured from the offset trigger:
| Offset | Hit ≥ 1R | Median remaining move |
|---|---|---|
| 0.0R (immediate) | 56.8% | 1.22 R |
| 0.5R | 50.3% | 1.01 R |
| 1.0R | 46.7% | 0.92 R |
No benefit. Every offset lowers both the hit rate and the remaining distance — the later the entry, the less move is left. The immediate entry is statistically superior.
Question 4 — Are Asia/overnight ranges relevant as sweep levels?
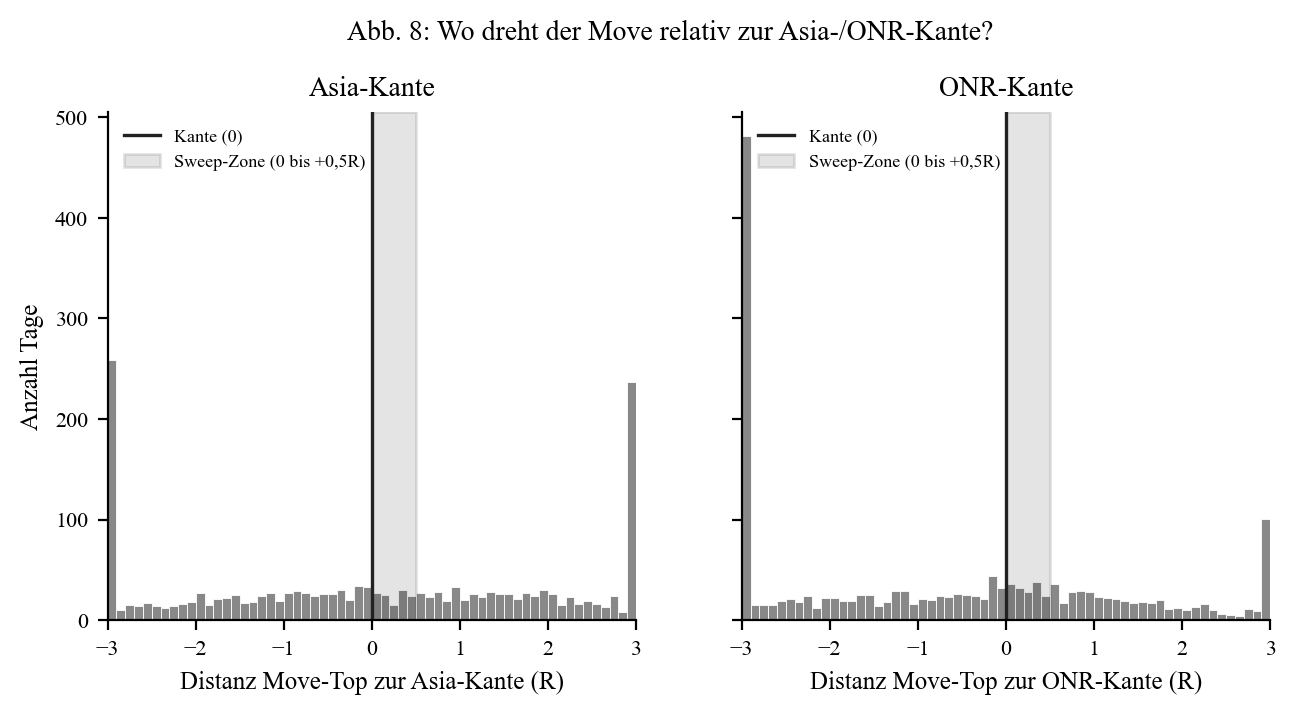
Does the move preferentially turn just beyond the Asia or overnight-range edge (a classic sweep pattern)? No. When the move reaches the Asia edge it simply runs through in 79.6% of cases and reverses just behind it in only 12.4%. At the ONR edge the tendency is a touch stronger (21.4% reverse), but running through still dominates. A genuine sweep pattern occurs on only 6.8–9.0% of all days — not a reliable signal.
Question 5 — Is the break out of a narrower candle worth it?
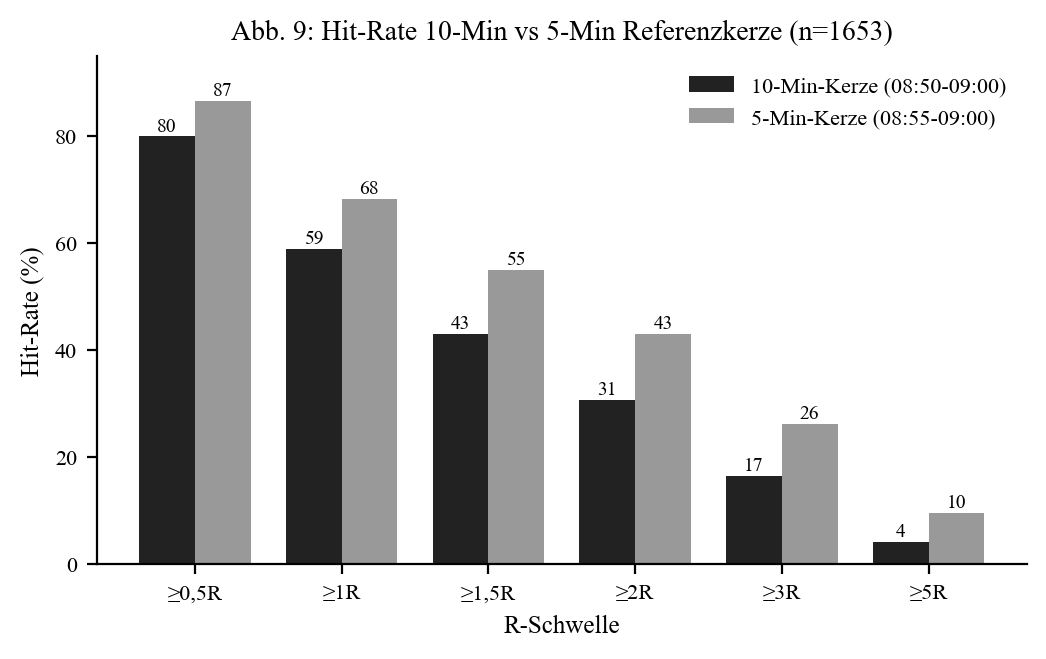
A narrower 5-min candle (08:55–09:00) instead of the 10-min candle — matched sample, n = 1,653:
| R threshold | 10-min | 5-min |
|---|---|---|
| ≥ 1.0R | 59.0% | 68.4% |
| ≥ 2.0R | 30.7% | 43.1% |
The catch is in the absolute points: the median move is ~23 points for both candles — the real morning move is independent of the candle choice. But because the 5-min candle is narrower (R-range 14.1 vs. 18.2 pts), the same move equals more R multiples. The price for that: a slightly higher stop-out rate (38.4% vs. 33.2%), since the tighter stop sits closer to entry.
Stability across 8 years
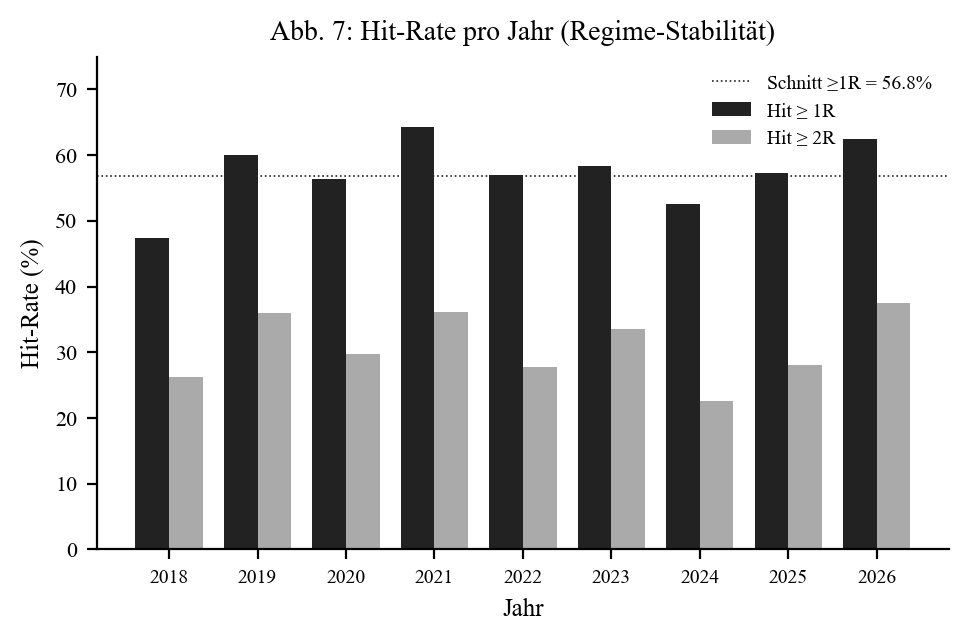
The ≥ 1R hit rate fluctuates between 47.4% (2018) and 64.3% (2021) across eight years — with no discernible trend. The first-half vs. second-half comparison (H1 57.1% / H2 56.5%) is statistically not significant (p = 0.829). The behaviour is stable through Covid, war/inflation and recovery.
Profit factor (a mechanical illustration — not a recommendation)
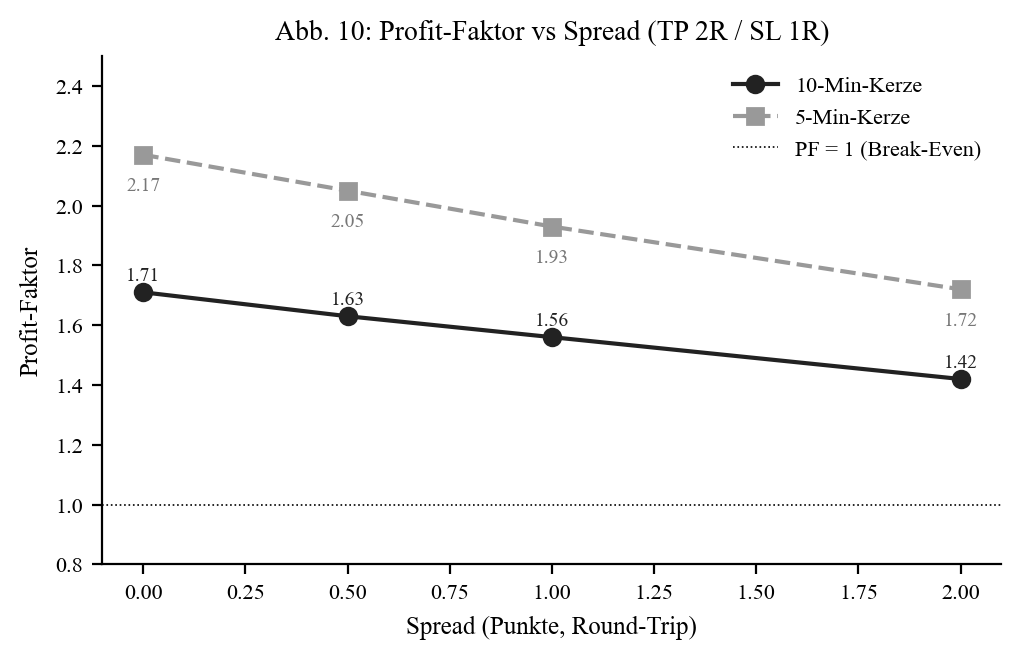
Important note: The following is a mechanical illustration to put the data in context — explicitly not a trading strategy and not a recommendation. Real results depend on execution, slippage, taxes and discipline.
Under a fixed rule set (entry at the break, SL = 1R at the opposite edge, TP at 1R/2R), the profit factor of both candles is above 1.0 across all TP levels and spread scenarios (0–2 pts). The narrower 5-min candle shows the higher value throughout (e.g. TP 2R at 1 pt spread: 1.93 vs. 1.56). This is a descriptive property of the historical price data under a fixed rule set — not a reliable expectancy for live trading.
Limitations (honest)
- Single-source data (bank broker, bid-aggregated). Other brokers tend to show smaller absolute point values; R multiples are robust to this.
- The move-end definition (first opposing candle or stop touch) is a choice — alternatives would yield different distances.
- Slippage and spread are not modelled in the range figures; move distances are pure tick excursions.
- Small sub-samples (late breaks, medium switch times n < 50) are noisy.
- Chi-square tests without Bonferroni correction; highly significant findings (p < 0.001) remain robust nonetheless.
- Not covered: profitability of concrete strategies, news events (FOMC/ECB/NFP), cross-asset transferability.
Conclusion
The DAX morning move out of the reference candle is a statistically stable phenomenon (≥ 1R on ~57% of days, robust across 8 years). The most reliable insights: instant breaks beat late ones, an offset adds nothing, the reversal only pays when immediate, Asia/ONR edges are not a reliable sweep signal, and the narrower candle gives the better risk-reward profile. This is an observation about market behaviour — not a finished strategy and not a return promise.
📄 Full study as PDF — 22 pages incl. all tables, significance tests (chi-square / Cohen's h) and glossary.
Disclaimer: Historical statistics are no guarantee of future market behaviour. This study is not investment advice. Trading involves risk of loss up to total loss.