Exit Logic for the 2nd-Candle Breakout: Does Moving the Stop Pay Off?
Data basis: DAX / FTSE / NQ / Dow M5 + M1, Jan 2018 – Feb 2026, ~2,090 trading days per index. Builds on the 2nd-candle study — identical trigger, focus exclusively on exit logic. Spread is baked into every metric (1 pt round-trip + 1 pt stop slippage). No trading recommendation, no return promise.
The 2nd-candle study showed when and how far the market runs after the break. This study answers the follow-up: how do you exit? 37 exit variants — including exit at the Asia session edge and the overnight-range edge (ONR) — are compared on identical trades against a fixed reference rule. Unlike the Phase-1 studies, spread is included in every R figure from the start (Phase-2 standard).
The reference rule (baseline)
| Parameter | Definition |
|---|---|
| Entry | at the break of the reference-candle edge |
| Stop-Loss | opposite edge of the reference candle (= 1R) |
| Take-Profit | none |
| Exit | stop-loss or end-of-day |
| Costs | 1 pt spread per closed position + 1 pt stop slippage |
Net of spread the baseline delivers a profit factor of 0.88 (FTSE) to 1.21 (NQ), mean 1.09 — only 3 of 4 indices profitable (FTSE turns negative with spread). The typical trend signature: high stop rate (57–68%), low win rate (28–37%), expectancy from the tail.
⚠️ The reference rule is a comparison anchor, not a validated live system. The profit factors are net-of-spread but not walk-forward-validated.
The core result
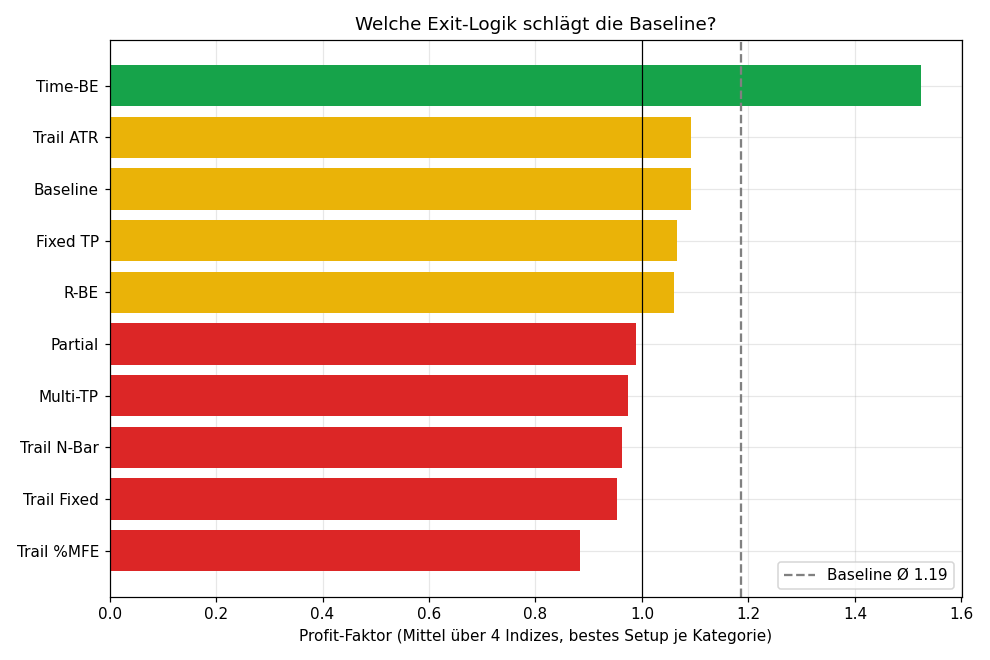
| Strategy | Mean PF | Profitable on |
|---|---|---|
| Time-BE 30 min | 1.52 | 4/4 |
| Time-BE 60 min | 1.30 | 4/4 |
| Exit@ONR + BE60 | 1.23 | 4/4 |
| Exit@Asia + BE60 | 1.22 | 4/4 |
| Time-BE 90 min | 1.22 | 3/4 |
| Baseline (hold EOD/SL) | 1.09 | 3/4 |
| Trailing Chandelier 3×ATR | 1.09 | 3/4 |
| Fixed TP 5R | 1.07 | 3/4 |
| Fixed TP 3R | 1.04 | 3/4 |
| Exit@Asia (alone) | 1.03 | 3/4 |
| Exit@ONR (alone) | 1.02 | 3/4 |
| Fixed TP 2R | 1.01 | 3/4 |
| Break-even @ 1R | 0.99 | 3/4 |
| Trailing %MFE 50 | 0.76 | 0/4 |
| Break-even @ 0.5R | 0.62 | 0/4 |
Only time-based break-even (stop to entry after a fixed time) and its combinations with the level exits beat the baseline on all four indices. Trailing, partials, multi-TP and early R-break-even are neutral to harmful.
Time break-even: spread corrects the artifact
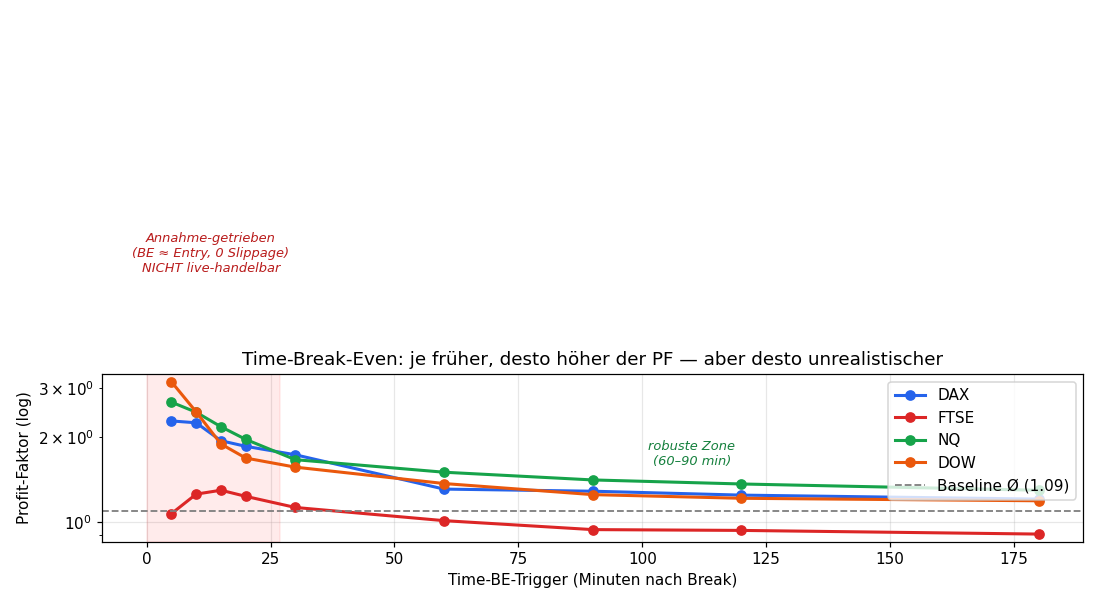
In the idealised (spread-free) prior version, PF rose into the absurd with earlier break-even (PF 22 at 5 min). With spread included this largely dissolves:
| BE timing | DAX PF | DAX Total-R | FTSE | NQ | Dow |
|---|---|---|---|---|---|
| 5 min | 2.29 | 175 | 1.07 | 2.67 | 3.15 |
| 10 min | 2.25 | 247 | 1.26 | 2.46 | 2.46 |
| 15 min | 1.95 | 252 | 1.30 | 2.18 | 1.89 |
| 20 min | 1.86 | 278 | 1.24 | 1.97 | 1.69 |
| 30 min | 1.73 | 345 | 1.13 | 1.67 | 1.57 |
| 60 min | 1.31 | 236 | 1.01 | 1.50 | 1.37 |
| 90 min | 1.29 | 261 | 0.94 | 1.41 | 1.25 |
| Baseline | 1.15 | 220 | 0.88 | 1.21 | 1.13 |
Key finding net-of-spread: the total-R optimum is now ~30 min (DAX 345 R), no longer 5 min (only 175 R) — spread eats the many break-even exits of the extreme-early variant. PF stays optically high at 5 min (2.29), but that's a survivor effect: at DAX, 1 pt spread is only ~2.6% of R (38 pts), too little for full collapse. Honest reading: 30 min is the sweet spot — best total-R at still-solid PF. For the FTSE (small R) spread pushes the whole curve down visibly — below 1.0 from 90 min on.
Risk profile over extra return
| Index | PF Ref → BE60 | Total-R Ref → BE60 | MaxDD Ref → BE60 | Win% Ref → BE60 |
|---|---|---|---|---|
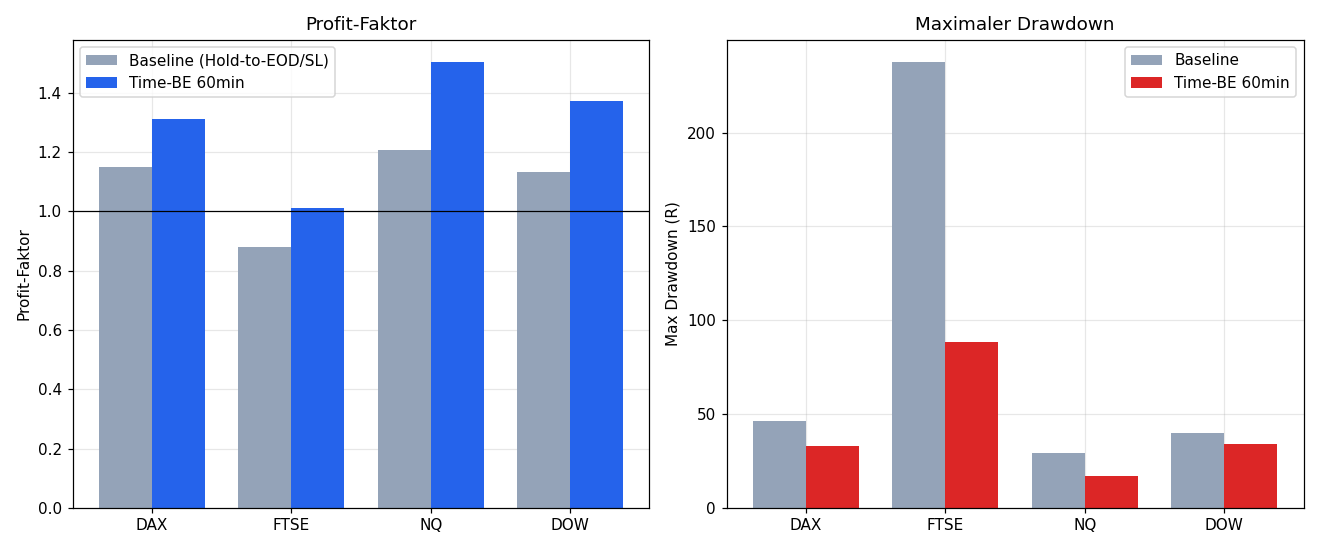
| DAX | 1.15 → 1.31 | 220 → 236 | 46R → 33R | 31% → 14% |
| FTSE | 0.88 → 1.01 | −198 → +12 | 238R → 88R | 28% → 13% |
| NQ | 1.21 → 1.50 | 273 → 381 | 29R → 17R | 37% → 20% |
| DOW | 1.13 → 1.37 | 180 → 276 | 40R → 34R | 34% → 18% |
The biggest effect is drawdown reduction (DAX −28%, FTSE −63%, NQ −41%) and that FTSE turns positive at all (−198 → +12 R). Total return rises moderately, win rate drops clearly — many trades end at break-even. Time-BE makes the strategy primarily calmer and more robust, not primarily more profitable.
Exit at the Asia/ONR edge
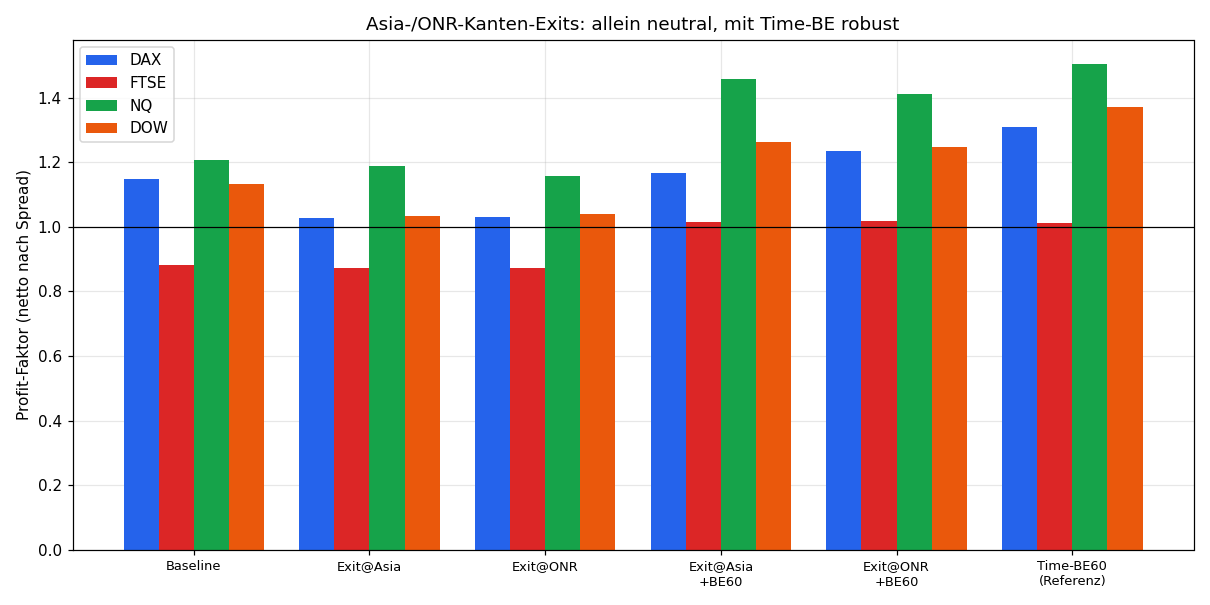
A natural idea: don't hold to the close, but take profit at the Asia session edge (00:00–08:00 Berlin) or the overnight-range edge (prev close → today open). These act as take-profits, the SL stays at 1R.
| Strategy | Mean PF | 4/4 | Exit distribution (ONR, avg) |
|---|---|---|---|
| Exit@Asia (alone) | 1.03 | 3/4 | — |
| Exit@ONR (alone) | 1.02 | 3/4 | 30% level, 52% SL, 17% EOD |
| Exit@Asia + BE60 | 1.22 | 4/4 | — |
| Exit@ONR + BE60 | 1.23 | 4/4 | — |
Finding: the edge alone as a TP triggers in ~30% of trades — and is barely better than the baseline (PF ~1.03). This matches the sweep finding of the prior study: the move breaks through the edge in 75–85% of cases instead of reversing there — so a TP at the edge cuts exactly the trend days that carry the expectancy. Only combined with Time-BE-60 (secure risk fast, then TP at the edge) does the approach become robustly 4/4 profitable (PF 1.22–1.23). The edge is weak as a sole target, but usable as a building block of a hedged exit.
The ceiling: what a perfect exit would capture
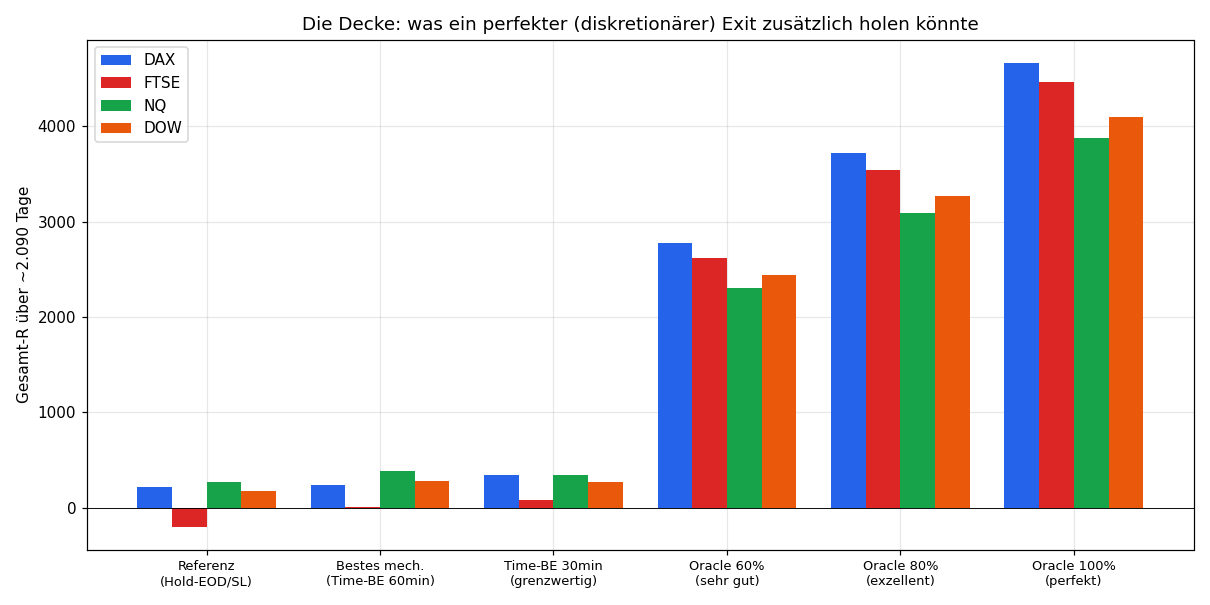
The oracle exit (exit exactly at the peak, perfect foresight) is the theoretical ceiling — net of spread:
| Exit | DAX | FTSE | NQ | Dow |
|---|---|---|---|---|
| Best mechanical (Time-BE 60) | 236 R | 12 R | 381 R | 276 R |
| Oracle 60% | 2,775 R | 2,620 R | 2,304 R | 2,446 R |
| Oracle 80% | 3,721 R | 3,542 R | 3,092 R | 3,272 R |
| Oracle 100% | 4,667 R | 4,464 R | 3,881 R | 4,098 R |
Even net of spread the perfect exit captures ~15–20× more than the best mechanical rule. Even 60% of the perfect move is ~2,500 R (~10×). The entire surplus lies not in the entry — that's identical — but solely in exit timing. This is where human discretion has its largest, mechanically-uncapturable lead. How close a real trader gets to the ceiling is decided by skill.
Pre-trade filters: do they help the edge?
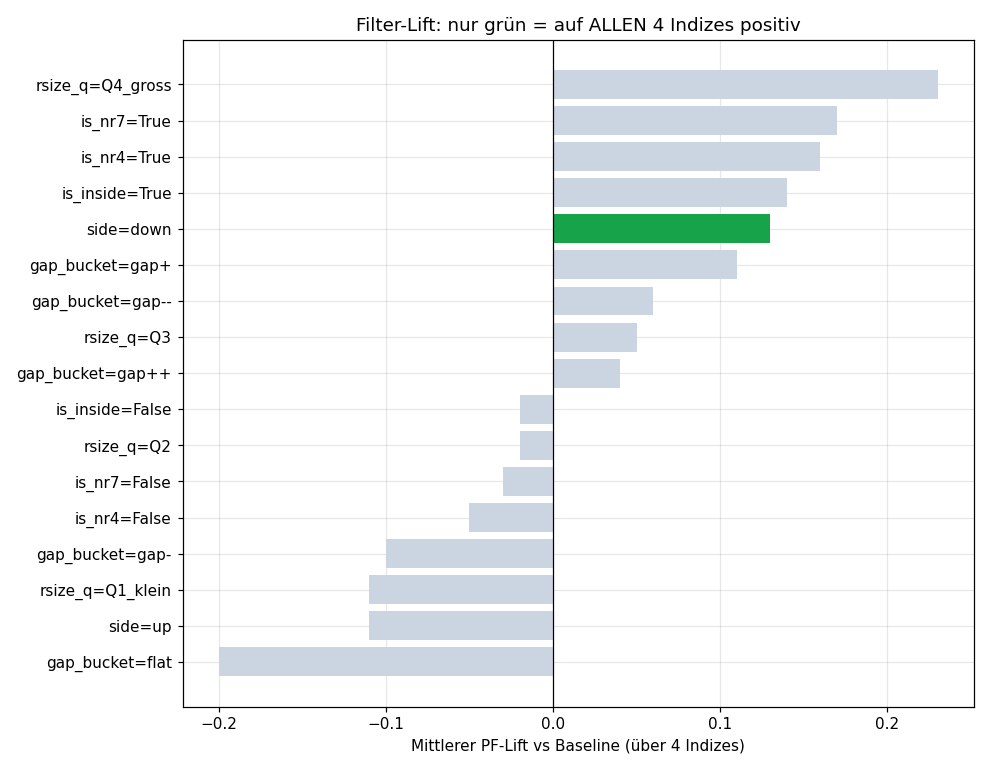
Edge building includes not just entry and exit but the question: do pre-trade filters improve the result? Seven filters are laid over the best ruleset (2nd-candle break + Time-BE-60, net of spread). What matters is not the mean PF lift, but whether the filter works on all four indices — otherwise it's likely overfitting. Every filter is an extra parameter and thus an overfit risk.
| Filter = value | Mean lift | Min lift | consistent 4/4 |
|---|---|---|---|
| Ref candle large (Q4) | +0.23 | +0.00 | no |
| NR7 / NR4 | +0.17 / +0.16 | −0.02 / −0.01 | no |
| Inside day | +0.14 | −0.09 | no |
| Short side (side=down) | +0.13 | +0.01 | yes |
Key finding: of seven filters, only the short side is consistently positive across all four indices. NR4, NR7, inside-day and large reference candle look attractive on average (+0.14 to +0.23 PF) but turn negative on at least one index — curve-fit. NR4 lifts the DAX PF impressively from 1.31 to 1.99, but does not generalise.
This is the overfitting trap in its purest form: a filter that shines on one market is usually chance — passing on four markets at once is the bar that separates real from apparent edges. The later validation therefore uses the lean ruleset without fragile filters.
Add-ons: pyramiding & size sweep
The last add-on of edge development is not a filter but an in-trade question: does it pay to add to winners (scale-in / pyramiding)? Tested on the base (2nd-candle + Time-BE-60, net of spread): when the running MFE reaches +1R (or +2R), an extra unit is bought at that level; a ratcheting shared stop trails up one step after each add. Crucially — exactly your point: not just full size, but ¼, ½, full and a tapered variant in a sweep.
Evaluation is not by PF but by the Kelly criterion: G* = geometric log-growth per trade at the growth-optimal leverage f* (what actually compounds capital — and penalises drawdown automatically).
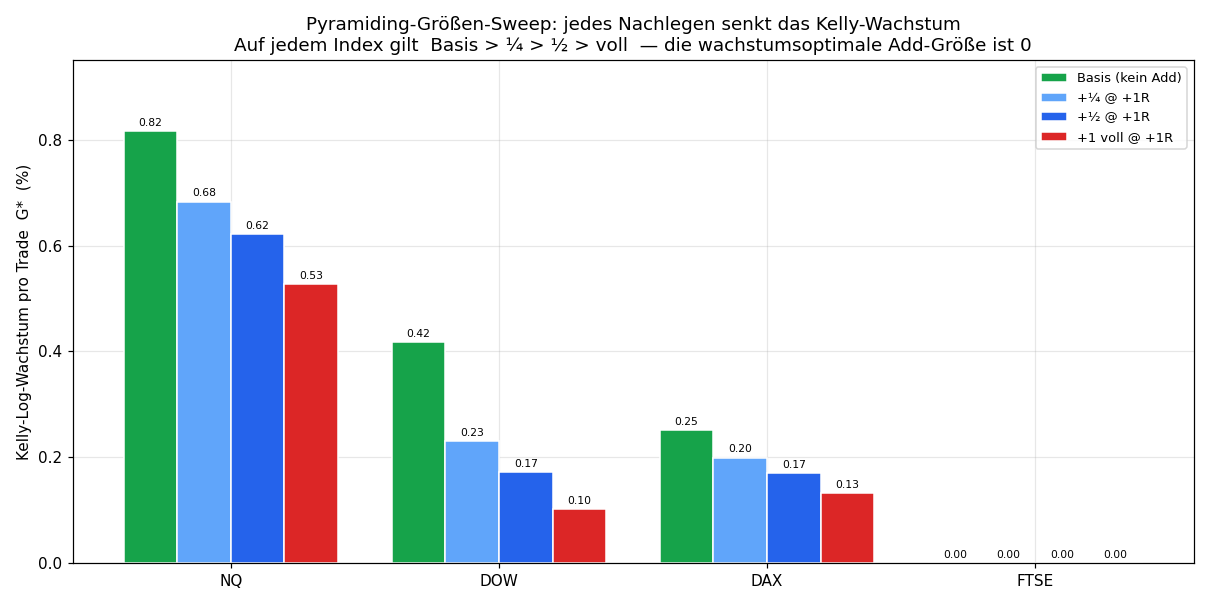
| Index | Metric | Base | ¼@1R | ½@1R | full@1R | tapered |
|---|---|---|---|---|---|---|
| NQ | G* (%/trade) | 0.82 | 0.68 | 0.62 | 0.53 | 0.58 |
| Kelly-f* | 0.10 | 0.08 | 0.07 | 0.05 | 0.07 | |
| DAX | G* | 0.25 | 0.20 | 0.17 | 0.13 | 0.17 |
| DOW | G* | 0.42 | 0.23 | 0.17 | 0.10 | 0.16 |
| FTSE | G* | 0.00 | ~0 | 0 | 0 | 0 |
Cross-asset mean vs base: ¼@1R −0.09, ½@1R −0.13, full −0.18, tapered −0.15 G* — no size is ≥ base on all four indices.
Key finding: the ordering is monotone on every index: base > ¼ > ½ > full. Smaller adds do less damage, but no size beats not adding at all. More than that: the Kelly leverage f* drops when you add (NQ 0.10 → 0.05) — pyramiding makes the strategy less leverageable, not more. It forces a perfectly correlated extra position at a worse entry (+1R) on the same stop; that raises variance more than the mean, and Kelly (= mean of log returns) penalises exactly that.
A momentum filter does not rescue it either. Adding only into fast trends (+1R reached within ≤ 30 min) still leaves Kelly growth below the base on all three edge markets (NQ 0.63 vs 0.82; DOW 0.17 vs 0.42; DAX 0.19 vs 0.25) — and the fast adds are actually the worst, because a fast spike to +1R is often an overextension that reverts and fills the add at the high. A spurious gain appears only on the edge-less FTSE — i.e. noise.
The clean consequence: the growth-optimal add size is 0. If you want more exposure on this edge, you lever the base uniformly — that is position sizing and belongs in Phase 4 (Kelly), not in a pyramiding mechanic. Plain bigger sizing scales every R linearly and leaves PF/recovery untouched; pyramiding degrades both.
Conclusion
Across four indices and ~2,090 days per index, net of spread:
- Trailing stops, partials, multi-TP add nothing — most make it worse, because they cut the tail or stop out normal pullbacks.
- Fixed take-profits barely survive the spread (PF ~1.0) — the edge is in the tail, not the target.
- Time break-even is the only mechanical modification with a genuine edge — net of spread, ~30 min is the sweet spot (best total-R), the effect lies mainly in drawdown reduction.
- Exit at the Asia/ONR edge alone is weak (cuts the tail), but combined with Time-BE robustly 4/4.
- The perfect exit captures ~15× — solely in exit timing, not the entry.
- Pre-trade filters almost never generalise — only the short bias holds cross-asset; every further filter is overfit risk.
- Pyramiding pays at no size — ¼/½/full/tapered all lower the Kelly growth; the growth-optimal add size is 0. Raising exposure belongs in Phase 4 as uniform leverage, not in a scale-in mechanic.
The lean ruleset built here next goes through the validation gate (Phase 3).
Limitations: spread modelled (1 pt), slippage only estimated as a stop surcharge — measurable for real only in forward testing. Reference rule = comparison anchor, not walk-forward-validated. Trend logic to EOD/SL. Single-source data (Dukascopy). News events/volume not covered.
📄 Full study as PDF · See also: 2nd opening candle · 7th opening candle
Disclaimer: Historical statistics are no guarantee of future market behaviour. Not investment advice. Trading involves risk of loss up to total loss.