Reference Candle Break Across Indices — FTSE, Dow & Nasdaq
Data basis: FTSE / Dow / Nasdaq M5 + M1 (bank broker, bid-aggregated), Jan 2018 – Feb 2026, 2,075–2,096 trading days per configuration. Methodology identical to the DAX study. No trading recommendation, no return promise.
This study transfers the methodology of the DAX reference-candle study to three more indices. For each index the breakout from a pre-market reference candle is analysed; the move ends at the first opposing candle or at the stop-loss touch of the opposite edge (1R risk) — whichever comes first.
| Index | Reference candle | Cash open (local) |
|---|---|---|
| FTSE 100 | 15 min (07:45–08:00) | 08:00 London |
| Dow Jones | 10 min (09:20–09:30) | 09:30 New York |
| Nasdaq 100 | 15 + 10 min | 09:30 New York |
Question 1a — How far does price break out?
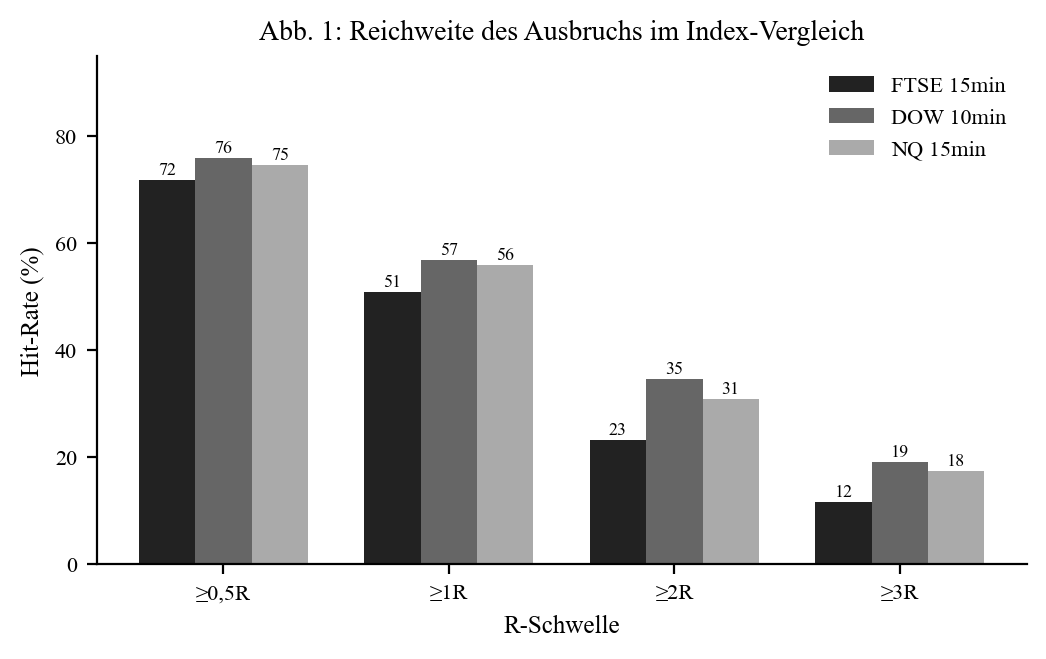
| Setup | R-med (pts) | ≥ 1R | ≥ 2R | ≥ 3R | SL hit |
|---|---|---|---|---|---|
| DAX 10min (ref.) | 17.6 | 56.8% | 30.1% | 16.5% | 37.2% |
| FTSE 15min | 9.5 | 50.9% | 23.2% | 11.6% | 33.7% |
| Dow 10min | 34.6 | 57.0% | 34.6% | 19.1% | 43.9% |
| NQ 15min | 19.5 | 56.0% | 30.9% | 17.5% | 44.9% |
| NQ 10min | 16.7 | 60.9% | 36.5% | 21.9% | 48.7% |
The ≥ 1R hit rate sits in a narrow band: 50.9% (FTSE) to 60.9% (NQ 10-min). The R-ranges in points differ widely (Dow 34.6 pts, FTSE only 9.5) — but the R normalisation keeps the setups comparable. FTSE runs back to the opposite edge least often (SL 33.7%).
Question 1b — Is the reversal worth trading?
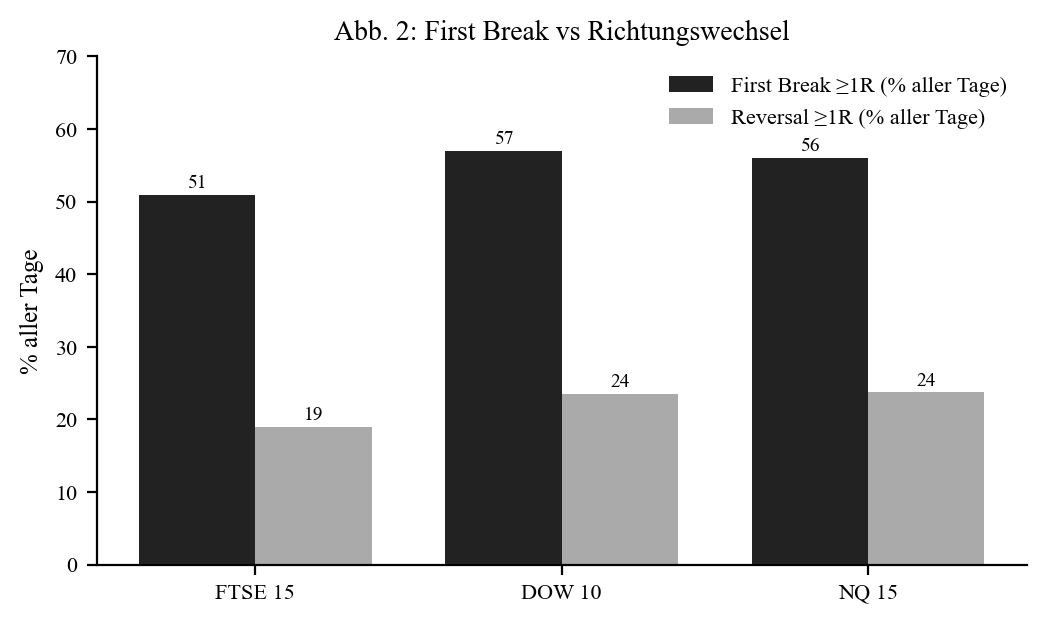
| Setup | Failed break | Opposite breaks | Opp ≥ 1R | Reversal (% of all days) |
|---|---|---|---|---|
| FTSE 15min | 49.1% | 91.0% | 42.3% | 18.9% |
| Dow 10min | 43.0% | 93.6% | 58.4% | 23.5% |
| NQ 15min | 44.0% | 93.5% | 57.6% | 23.7% |
| NQ 10min | 39.1% | 95.5% | 65.5% | 24.4% |
As with the DAX, the counter-move is weaker everywhere than the first break. Most clearly with the FTSE (only 42.3% of counter-breaks reach 1R, median 0.74 R). The reversal is not an equal alternative on any index.
Question 2 — timing dominates everywhere
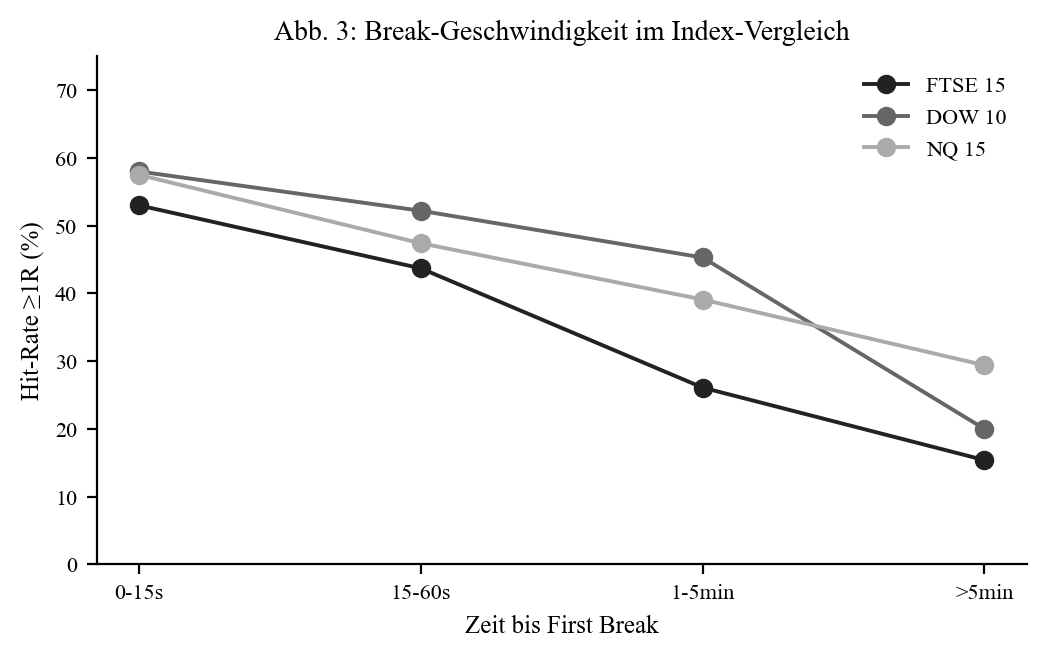
Instant breaks (≤ 15 s) are strongest on all indices (53–62% hit ≥ 1R); later breaks drop off clearly.
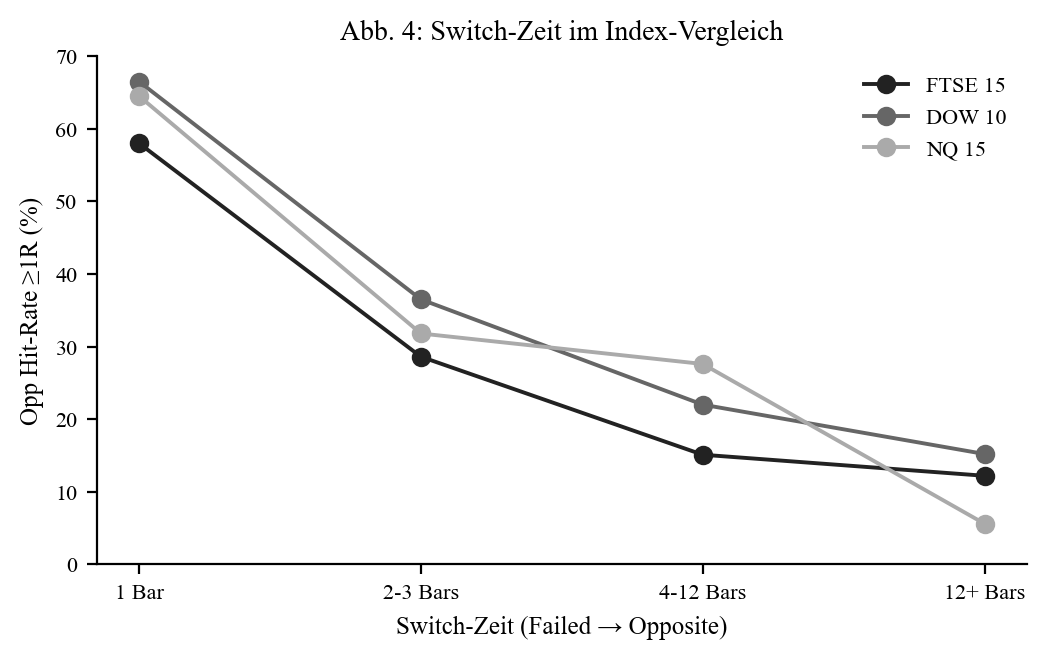
The reversal is the same story: the immediate counter-break (1 bar) is by far the most successful (58–70%), delayed switches collapse. Identical to the DAX finding.
Question 3 — offset gives no benefit
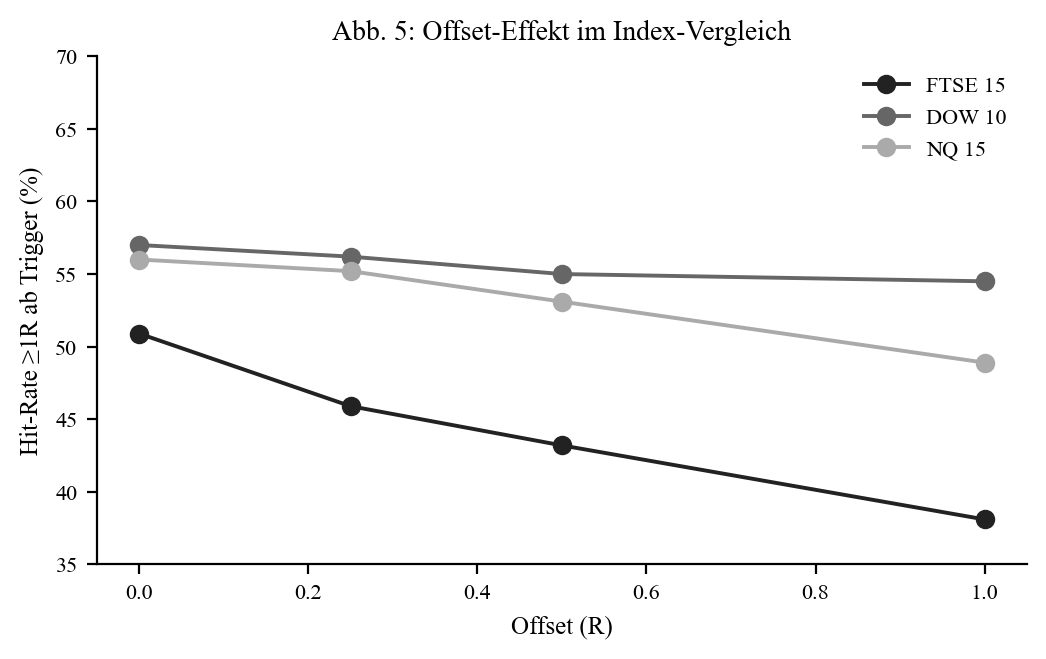
On all indices the hit rate falls as the offset grows (e.g. FTSE 50.9% → 38.1% at 1R). The immediate entry is superior everywhere — exactly as with the DAX.
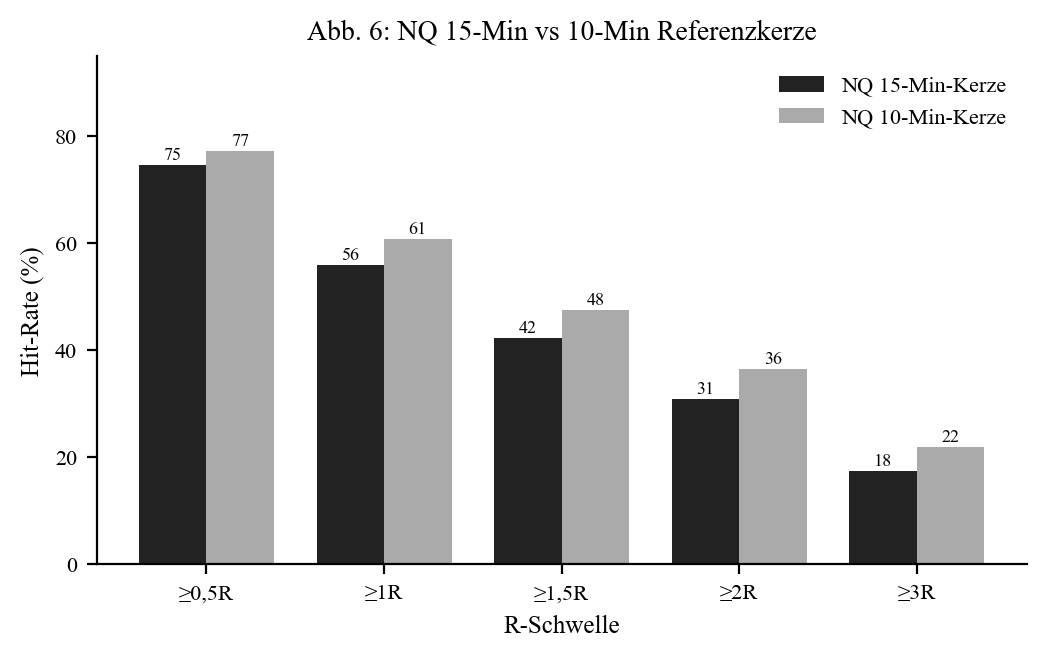
Nasdaq — is the narrower candle worth it?
| Metric | NQ 15-min | NQ 10-min |
|---|---|---|
| R-range median (pts) | 19.5 | 16.7 |
| Hit ≥ 1R | 56.0% | 60.9% |
| Median move | 1.21 R | 1.39 R |
| Stop-loss rate | 44.9% | 48.7% |
The narrower 10-min candle delivers higher R values at a moderately higher stop rate — replicating the DAX finding exactly (question 5): same absolute move, smaller risk → more R yield.
Conclusion (cross-asset)
The reference-candle-break pattern is consistent across DAX, FTSE, Dow and Nasdaq (hit ≥ 1R in the 50.9–60.9% band). The transferability question left open in the DAX paper is therefore answered positively — the effect is not DAX-specific. FTSE is the weakest index, NQ/Dow the strongest. Timing dominates everywhere; an offset hurts; the narrower candle helps.
Not covered (DAX paper only): Asia/ONR sweep, profit factor, spread sensitivity. Single-source data; news events/slippage not modelled.
Disclaimer: Historical statistics are no guarantee of future market behaviour. Not investment advice. Trading involves risk of loss up to total loss.