Phase 5 — The Finished Algorithm: MT5 Expert Advisor & Reference Backtest
Data basis: reference backtest of the exact EA logic on Dukascopy OOS 2023–2026, net of spread (1 pt). Core: NQ (gate passed) + DAX (borderline). The CAGRs shown are historical OOS trajectories, NOT a return forecast. The clean final test is the MT5 forward run. No trading recommendation.
This is Phase 5 — deployment. After idea+data (Phase 1), edge construction (Phase 2), the validation gate (Phase 3) and position sizing (Phase 4), the ruleset is assembled into a runnable MetaTrader 5 algorithm — and evaluated honestly.
The assembled system
| Block | Definition | Source |
|---|---|---|
| Entry | break of the 2nd 15-min candle after cash open | Phase 1/2 |
| Stop | opposite edge = 1R | Phase 2 |
| Exit | Time-BE after 60 min → break-even, else SL/EOD | Phase 2 |
| Add-ons | none (filters & pyramiding rejected) | Phase 2 |
| Sizing | conservative 1%/trade · aggressive quarter-Kelly | Phase 4 |
| Risk | daily-loss-limit + max-DD-stop (20%) | Phase 4 |
| Markets | NQ (core) + DAX (borderline) | Phase 3 gate |
Results — conservative (1% risk/trade)
This is the serious deploy anchor: a fixed 1% account risk per trade, independent of fitted Kelly values.
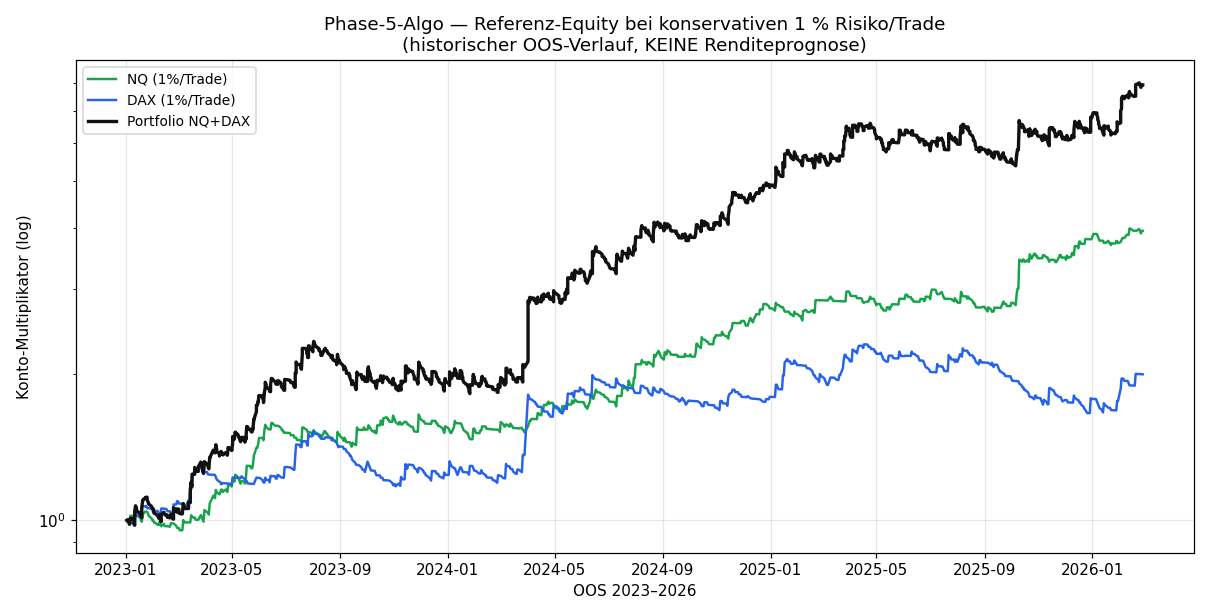
| Market | OOS PF | Sharpe | CAGR | MaxDD | Calmar |
|---|---|---|---|---|---|
| NQ | 1.52 | 1.86 | +54.7% | 11.1% | 4.91 |
| DAX | 1.27 | 0.84 | +24.6% | 27.9% | 0.88 |
| Portfolio NQ+DAX | — | 1.81 | +92.6% | 22.0% | 4.21 |
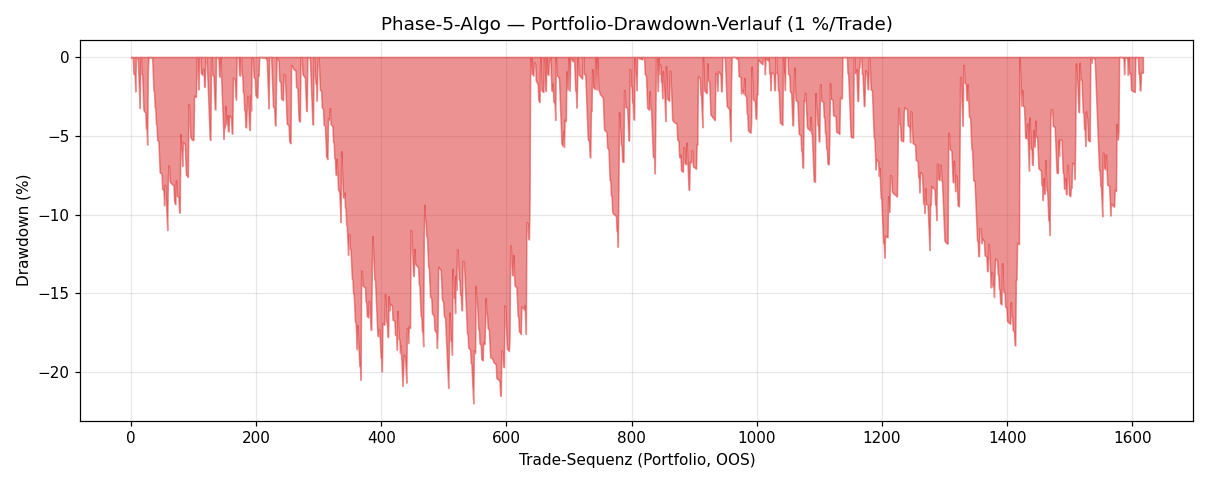
Reading: NQ carries the algo — Sharpe 1.86, MaxDD only 11%, Calmar ~5. DAX is the weak link: at the same 1% risk it has a Calmar below 1 (24.6% return against 27.9% drawdown) — exactly the borderline gate result from Phase 3, now visible in the equity curve. The portfolio benefits from the session offset (NQ NY, DAX Frankfurt → barely any overlap), drawdown 22%.
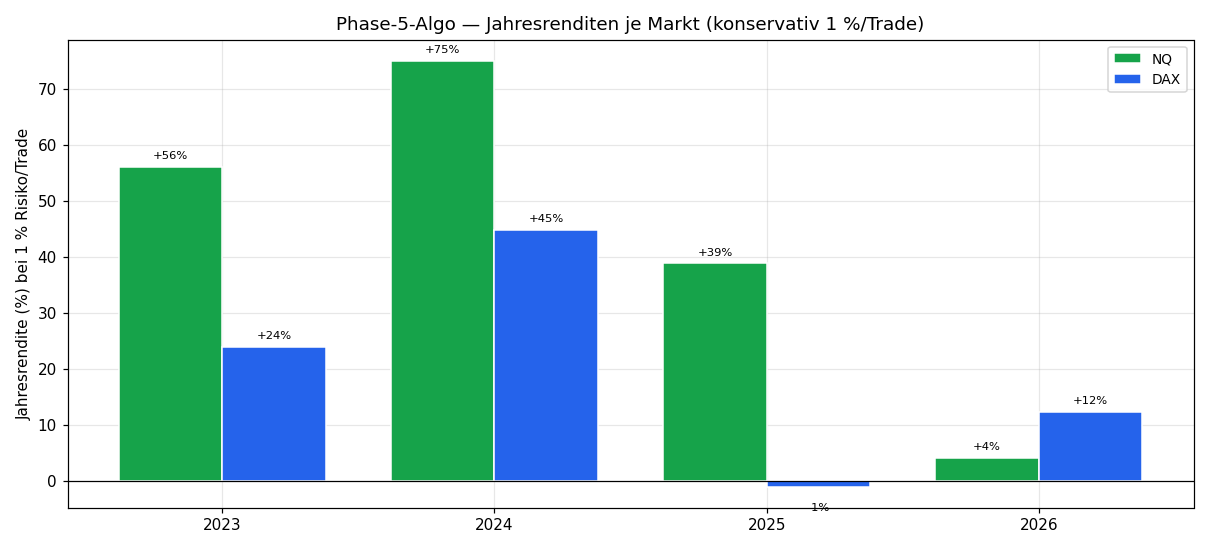
| Market | 2023 | 2024 | 2025 | 2026* |
|---|---|---|---|---|
| NQ | +56% | +75% | +39% | +4% |
| DAX | +24% | +45% | −1% | +12% |
*2026 partial year only. NQ positive every year; DAX has a flat year (2025) — again pointing to the borderline DAX edge.
Results — aggressive (quarter-Kelly) and why you must distrust them
| Market | Quarter-Kelly risk | CAGR | MaxDD | + max-DD-stop 20% |
|---|---|---|---|---|
| NQ | 2.5%/trade | +170% | 26.7% | MaxDD 21% |
| DAX | 0.9%/trade | +23% | 26.0% | MaxDD 21% |
| Portfolio | — | +232% | 30.0% | MaxDD 22% |
⚠️ These numbers are the mathematical ceiling of the fitted edge, not an expectation. Three reasons to distrust them: (1) the Kelly leverage f* is fitted to this exact OOS series — quarter-Kelly is a quarter of an in-sample-optimal leverage. (2) The OOS block comes from the same dataset (2018–2026), not a true forward. (3) Real slippage/spread are worse than modelled. A +232% CAGR is not a promise — it only shows how strongly a frequent edge compounds if it continues exactly like this. It won't.
The max-DD-stop (halt trading at 20% account DD, resume on a new shadow high) caps the worst drawdown at ~21–22% even under aggressive sizing.
Reality: the actual MT5 run vs. buy-and-hold
The reference backtest above is idealised (only 1 pt spread, clean bar fills). The real MT5 strategy tester on Pepperstone data (2021–2026, 1% risk/trade) tells the truth — and the honest yardstick is not the backtest but buy-and-hold of the index and the ceiling of the perfect exit.
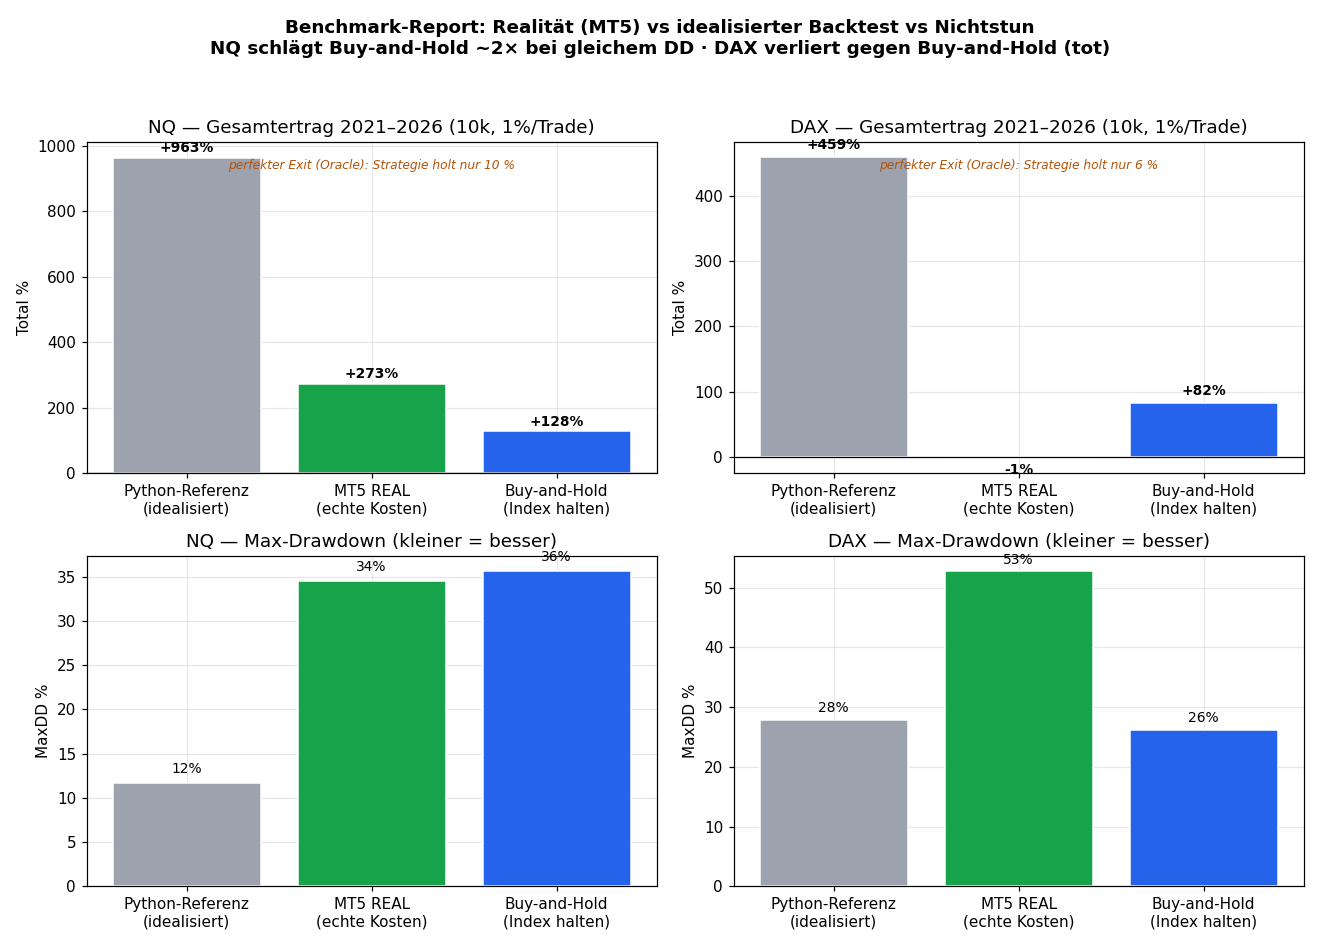
| Benchmark (NQ, 2021–2026, 10k, 1%/trade) | Total | MaxDD |
|---|---|---|
| Optimal exit (oracle, perfect) | ceiling — strategy captures only ~10% | — |
| Python reference (idealised) | +963% | 11.7% |
| MT5 REAL (Pepperstone) | +273% | 34.5% |
| Buy-and-hold (hold the index) | +127% | 35.6% |
NQ finding: in reality the algo beats buy-and-hold ~2.1× (+273% vs +127%) at the same drawdown — genuine added value, intraday, both directions. But real costs cost −72% return and triple the drawdown vs the idealised backtest (11.7% → 34.5%). The backtest was far too optimistic, especially on risk.
| Benchmark (DAX, 2021–2026) | Total | MaxDD |
|---|---|---|
| Python reference (idealised) | +459% | 27.9% |
| MT5 REAL | −1% | 52.7% |
| Buy-and-hold | +82% | 26.2% |
DAX finding: real −1% — clearly loses to buy-and-hold (+82%) at double the drawdown. DAX is dead (both directions traded: 700 long / 660 short — it fails on edge, not direction). → NQ-only is the clean choice.
Edge perishability: why "works in the backtest" ≠ "works"
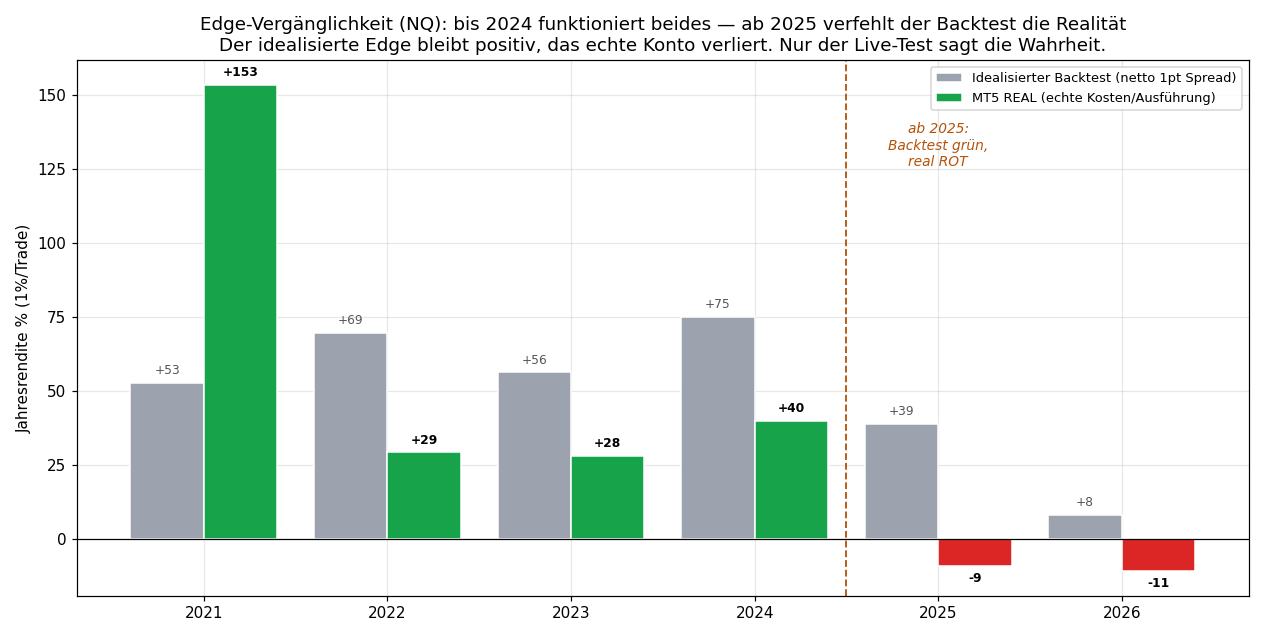
The most important chapter — and the one missing from 99% of strategy literature. The real MT5 run on NQ was excellent through end-2024 (peak ~€49,500 on 2024-12-26), then negative.
| Year | Backtest (idealised) | MT5 REAL |
|---|---|---|
| 2022–2024 | +56 … +75% | +28 … +40% (positive) |
| 2025 | +39% | −9% |
| 2026 (partial) | +8% | −11% |
The striking part: the backtest stayed green, the real account lost. And it is not the costs — NQ ranges actually grew in 2025/26 (89→112 pts), relative spread shrank. All the outperformance vs buy-and-hold was earned by end-2024; since 2025 the pure algo makes no money.
The lesson: edges are perishable — and a backtest can lie, even a clean one. What survives the idealised test can die live on real microstructure that daily bars don't capture. Only the live/forward test tells the truth. Anyone running an algo mechanically needs a rolling-PF kill-switch (which would have flagged 2025 here), a discretionary overlay — or the discipline to retire a spent edge and find a new one.
The Expert Advisor
The complete, deployable MQL5 code: SecondCandleBreak_EA.mq5
Implements the reference logic 1:1: 2nd-15min-candle break entry, Time-BE-60, EOD close, risk-% sizing, daily-loss-limit and max-DD-stop. Key inputs:
InpRefStartHour/Min— start of the 2nd 15-min candle (in broker server time!)InpSessCloseHour/Min— EOD closeInpRiskPct— risk per trade (default 1.0)InpAllowShort— allow the short side (bias filter)InpMaxDDStopPct,InpDailyLossPct— risk overlays
Calibration: all times must be set in broker server time, not exchange local time — otherwise the reference candle hits the wrong window. NQ and DAX need different values.
How to verify it yourself (the real test)
- Load the EA in MT5, calibrate the times to your broker.
- Strategy Tester over 2023–2026 with "every tick based on real ticks" — compare against the reference backtest above.
- Demo forward from today — that is the only true out-of-sample, because our OOS block comes from the same historical dataset.
MT5 tester numbers will differ slightly (broker data, tick model, real spreads) — that is expected and part of the honesty of this evaluation.
Conclusion
- The algo exists, is deployable and beat buy-and-hold — NQ real +273% vs +127% at the same drawdown over 2021–2026. Genuine added value, intraday, both directions.
- But the edge is spent — for now. All the outperformance was earned by end-2024; 2025 (−9%) and 2026 (−11%) the pure algo lost in reality, while the backtest stayed green.
- DAX is dead — real −1%, worse than holding the index at double the drawdown. NQ-only is the clean choice.
- The backtest lies about risk — real costs tripled the drawdown (11.7% → 34.5%) and the idealised edge did not survive live. Only the forward test counts.
Consequence for live use: do not run it blindly mechanical. Mandatory is a rolling-PF kill-switch (would have stopped 2025), a discretionary exit overlay (only ~10% of the perfect exit is captured) — or retiring the edge.
Limitations: MT5 tester = 56% real ticks, real broker spread but single-broker. OOS from the same overall dataset — true OOS = live from today. Kelly-f* fitted in-sample. Single-source data (Dukascopy). Edge decay since 2025 documented; cause (microstructure vs. true exhaustion) only finally resolvable live.
📄 Full study as PDF · 💻 Expert Advisor (.mq5) · Part of the series: Exit logic (Phase 2) · Validation gate (Phase 3) · Position sizing (Phase 4)
Disclaimer: Historical statistics are no guarantee of future market behaviour. Not investment advice. Trading involves risk of loss up to total loss.