Position Sizing & Kelly: How Much Risk on the Validated Edge?
Data basis: out-of-sample series (2023–2026) of the validated ruleset (2nd-candle break + Time-BE-60, net of spread). NQ (gate passed) + DAX (borderline). The CAGRs shown are historical OOS paths, NOT a return forecast. No trading recommendation.
Only after passing the validation gate may risk be discussed — and only on the core that survived it: NQ (clearly passed) and DAX (borderline). This study answers the final mechanical question: what percentage of the account do you risk per trade?
Position sizing is an amplifier on an edge, not an edge generator. That's why it comes last — never before. And it is computed from the out-of-sample parameters, not the inflated in-sample value.
Optimal-f (Kelly) per market
Kelly-f maximises the long-run growth rate E[log(1 + f·r)] over the R-series. The result is directly the "% account risk per trade".
| Market | OOS PF | Win% | Avg win | Avg loss | Optimal-f (full Kelly) |
|---|---|---|---|---|---|
| NQ | 1.52 | 21.0% | +2.56R | −0.45R | 10.2% / trade |
| DAX | 1.27 | 13.2% | +3.69R | −0.44R | 3.7% / trade |
NQ allows a higher Kelly-f because its edge is stronger. But: these full-Kelly values are not tradeable — see the drawdowns.
Why full Kelly is suicide
| Fraction | NQ risk/trade | NQ CAGR | NQ MaxDD | DAX risk | DAX CAGR | DAX MaxDD |
|---|---|---|---|---|---|---|
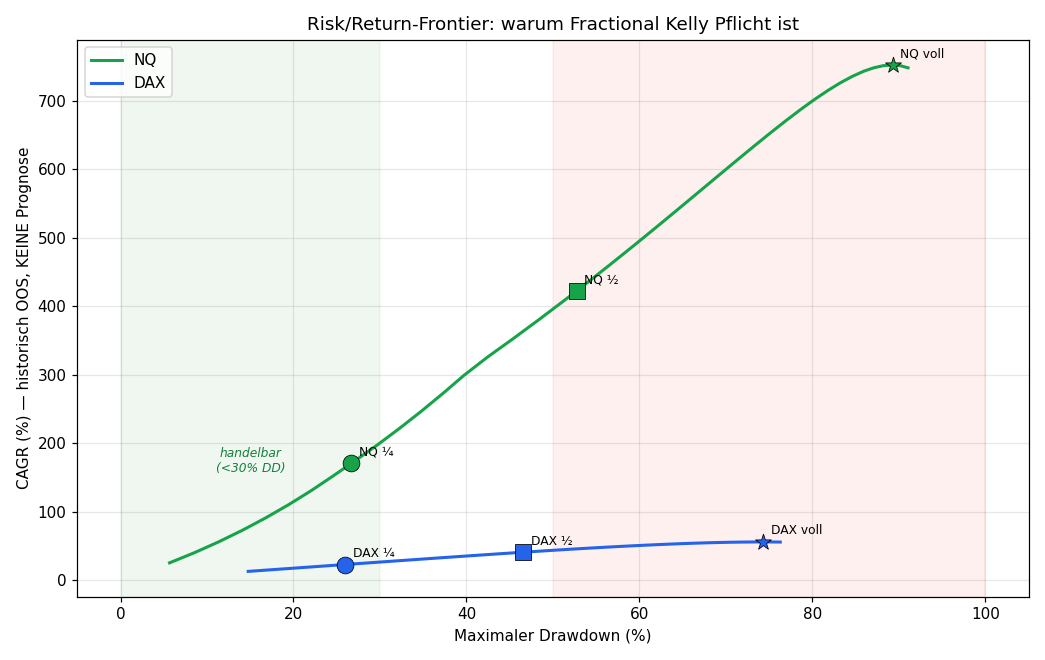
| Full Kelly | 10.15% | +752% | 89% | 3.70% | +56% | 74% |
| Half Kelly | 5.08% | +423% | 53% | 1.85% | +41% | 47% |
| Quarter Kelly | 2.54% | +170% | 27% | 0.92% | +23% | 26% |
Full Kelly means 89% drawdown (NQ) resp. 74% (DAX) — no account and no trader survives that psychologically. Half Kelly barely halves the return but pushes DD to ~50% (still brutal). Only quarter Kelly brings the drawdown to ~26–27% — the limit of the practically tradeable.
The frontier shows the Kelly truth: return grows linearly with f, but risk grows disproportionately. Beyond quarter Kelly you buy little extra return for a lot of extra pain.
Equity curves
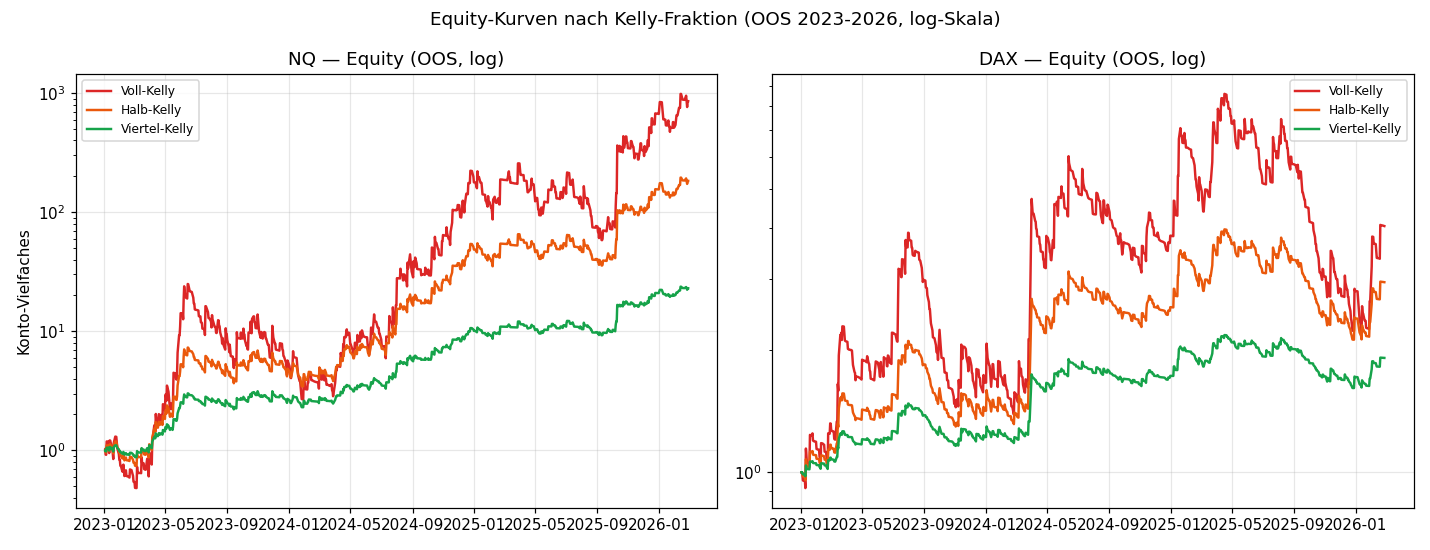
On a log scale it's visible: full Kelly (red) has the steepest climbs but also the deepest crashes. Quarter Kelly (green) runs calmer — the path a real trader can endure.
Risk overlays on quarter Kelly
| Overlay | NQ result | DAX result |
|---|---|---|
| Quarter Kelly pure | x19.5 / MaxDD 27% | x1.9 / MaxDD 26% |
| + Vol-targeting | x9.4 / MaxDD 33% | x0.97 / MaxDD 41% |
| + Max-DD-stop 20% | x23.0 / MaxDD 21% | x1.73 / MaxDD 21% |
- Max-DD-stop 20% (equity-curve trading: halt at 20% account DD, re-enter when shadow equity makes a new high) caps drawdown cleanly at ~21% — and costs nothing on NQ (even better), little on DAX. Recommended overlay.
- Vol-targeting (f inverse to rolling R-vol) barely helped or hurt here — R-vol isn't stable enough to predict.
Recommended sizing
Market:       NQ (primary), DAX (smaller, secondary)
Risk/trade:   Quarter Kelly
              → NQ  ~2.5% of account per trade
              → DAX ~0.9% of account per trade
Overlay:      Max-DD-stop at 20% account drawdown
Daily limit:  max 1 trade/day (setup-driven) → no separate daily-loss-limit needed
Conservative start: begin with half of that (eighth Kelly), scale up live only after 40+ real trades confirm the backtest.
⚠️ The most important warning
The CAGR values (+170% quarter Kelly NQ) are NOT a return forecast. They are the historical compounding of the OOS series of a ruleset whose exit was selected from 37 variants in-sample. Expect considerably less live, because:
- The edge degrades live (selection effect, regime change)
- Slippage is higher than the modelled 1-pt surcharge
- Not every fill is achieved
- The fat R-tail distribution biases compounding optimistically
Kelly maximises growth assuming the edge is stationary and known — neither is ever true. Exactly therefore: fractional, OOS-based, with DD-stop, and only after a forward test live.
Conclusion of the algo pipeline
Phase 1 ✅ Idea + data (3 studies)
Phase 2 ✅ Exit logic + baseline (net of spread)
Phase 3 ✅ Validation gate (only NQ passes strictly, DAX borderline)
Phase 4 ✅ Position sizing (quarter Kelly + DD-stop)
─────────────────────────────────────────
Phase 5 ⏳ Live forward test (true OOS from today)
The next and only remaining step is the live forward test on demo with real-time data — the only truly clean out-of-sample check. Only when it confirms the edge under realistic slippage does real capital see the algo.
Limitations: Kelly on the OOS series (2023–2026, ~800 trades per market) — even that is not a true forward-OOS. CAGR values historical, not predictive. Spread modelled, slippage estimated. Single-source data. Sizing in % account risk, without margin/funding costs.
📄 Full study as PDF · Part of the series: Exit logic (Phase 2) · Validation gate (Phase 3)
Disclaimer: Historical statistics are no guarantee of future market behaviour. Not investment advice. Kelly-based sizing can lead to large drawdowns up to ruin. Trading involves risk of loss up to total loss.