Trend-Day Detection via the 2nd Opening Candle
Data basis: DAX / FTSE / NQ / Dow M5 + M1, Jan 2018 – Feb 2026, ~2,090 trading days per index. Move logic: to end-of-day or stop-loss (trend tracking). No trading recommendation, no return promise.
This study tests the popular claim that the 2nd 15-minute candle after cash open delivers an especially tradeable trend breakout. The key difference from the pre-market study: the move is not ended at the first opposing candle but tracked to the close — unless the stop-loss (opposite edge, 1R) is hit first. That captures genuine trend days.
| Index | 2nd candle (local) |
|---|---|
| DAX | 09:15–09:30 |
| FTSE 100 | 08:15–08:30 |
| Nasdaq / Dow | 09:45–10:00 NY |
Range & trend-day distribution
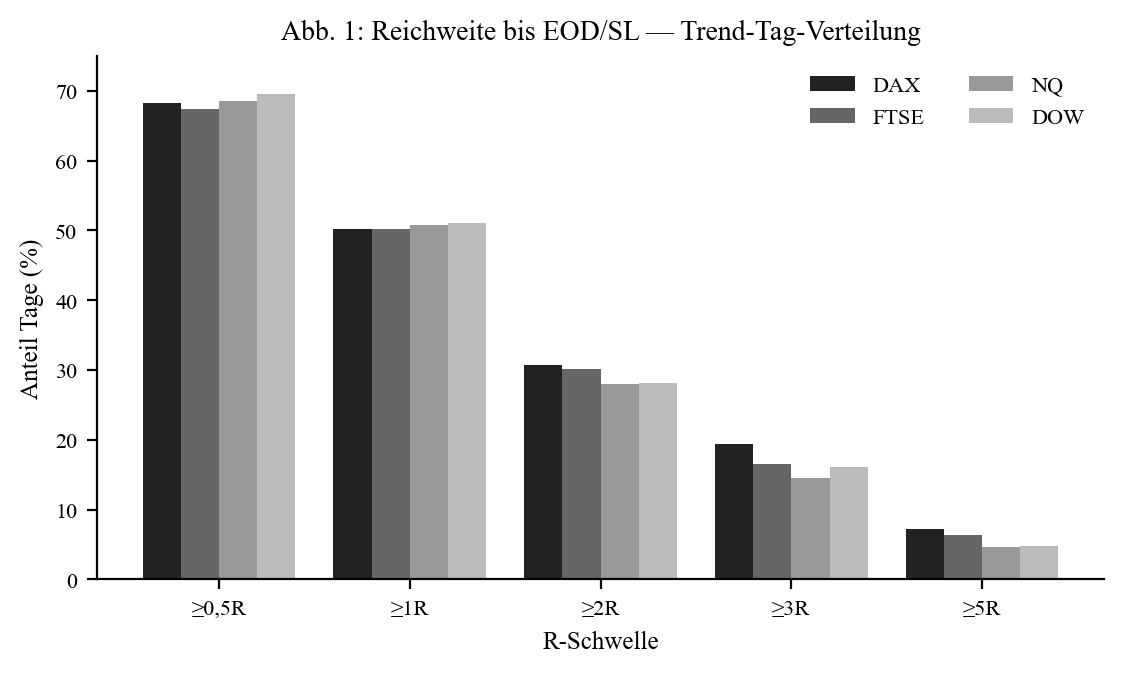
| Index | R-med (pts) | ≥ 1R | ≥ 2R | ≥ 3R | ≥ 5R |
|---|---|---|---|---|---|
| DAX | 38.0 | 50.2% | 30.7% | 19.4% | 7.2% |
| FTSE | 15.2 | 50.2% | 30.1% | 16.6% | 6.4% |
| NQ | 48.0 | 50.8% | 28.0% | 14.5% | 4.7% |
| Dow | 82.0 | 51.0% | 28.1% | 16.1% | 4.8% |
About one day in two reaches ≥ 1R. Genuine trend days (≥ 3R) are rarer (14–19%), big trends (≥ 5R) rare (5–7%). DAX and FTSE show the fattest trend tails.
Stop rate vs. trend tail — the trend signature
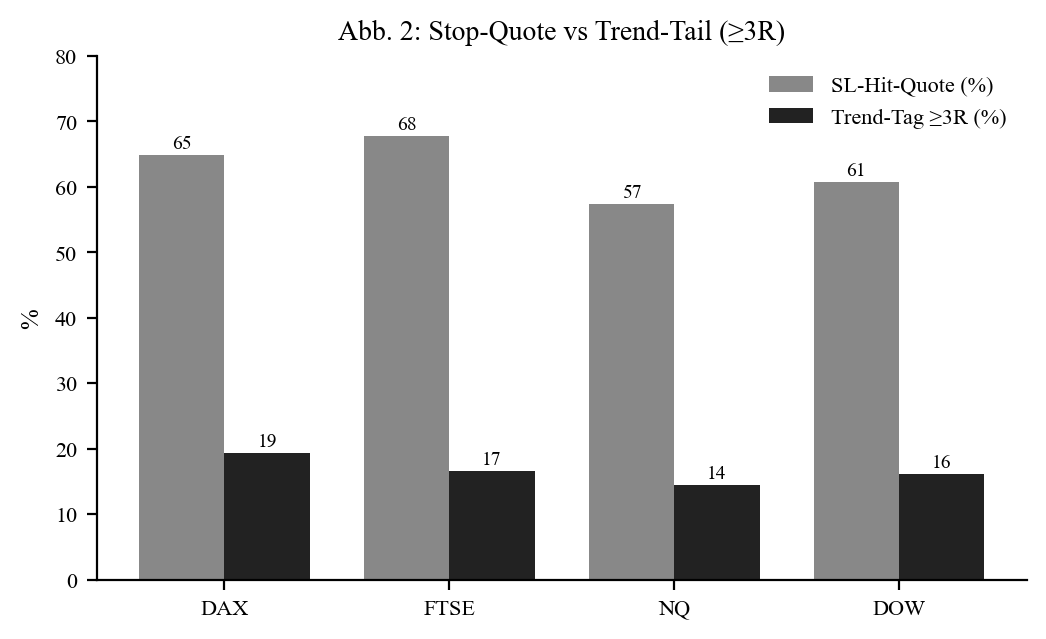
Because the position is held to the close, the stop rate is high: 57.4% (NQ) to 67.8% (FTSE). That isn't a flaw but the nature of trend trading: many small stops, few large runners. The expectancy comes from the tail, not the hit rate.
Timing — (almost) irrelevant here
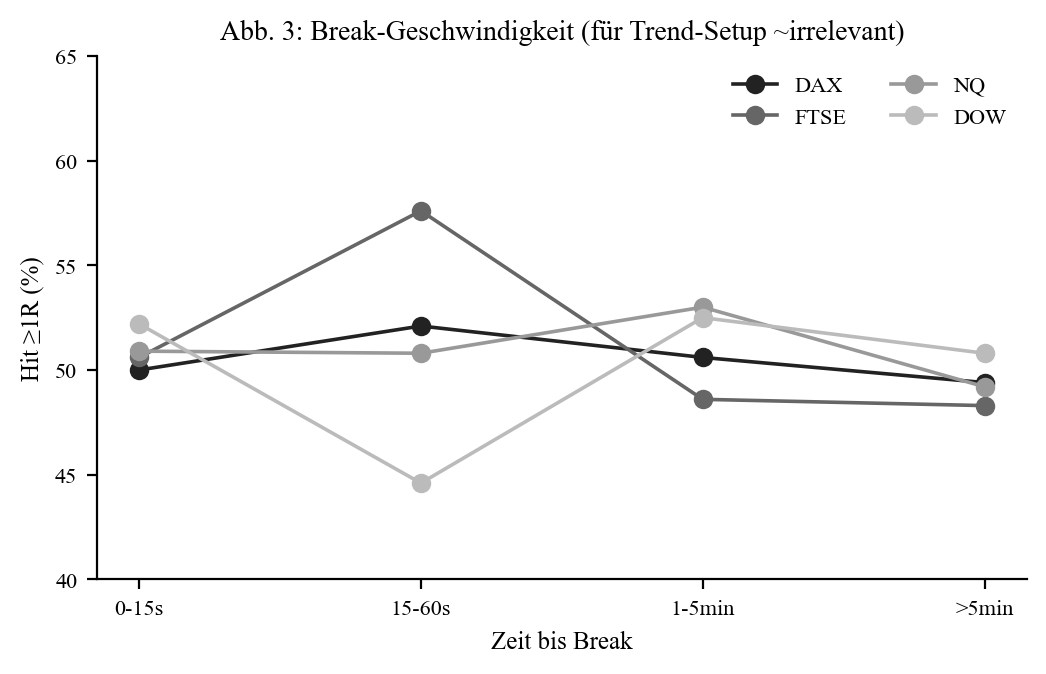
Unlike the pre-market candle, the hit rate is near-constant (~50%) across all timing buckets. When the break happens says little about trend success — plausible, since the trend day develops over hours.
Offset — confirmation pays off (the opposite of the pre-market candle!)
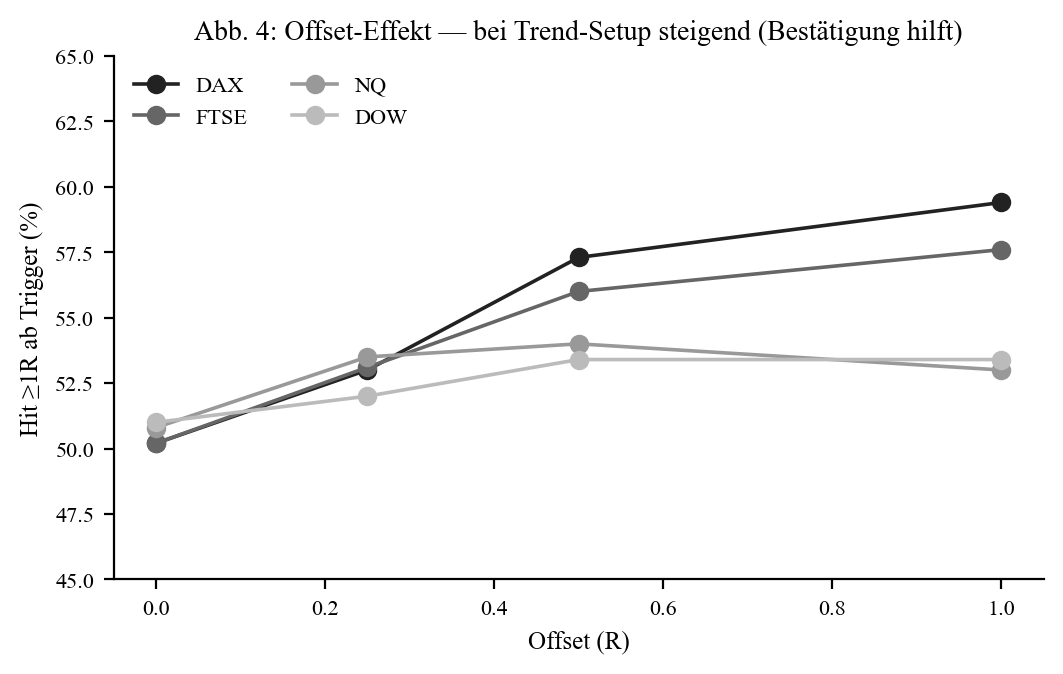
| Index | 0R (immediate) | 0.5R | 1.0R |
|---|---|---|---|
| DAX | 50.2% | 57.3% | 59.4% |
| FTSE | 50.2% | 56.0% | 57.6% |
| NQ | 50.8% | 54.0% | 53.0% |
| Dow | 51.0% | 53.4% | 53.4% |
Perhaps the most important finding: an offset raises the hit rate here (DAX 50.2% → 59.4% at 1R). It filters out the immediate false breaks — waiting for confirmation catches the genuine trend days more often. This is the exact opposite of the pre-market candle, where every offset hurt.
Reversal & Asia/ONR sweep
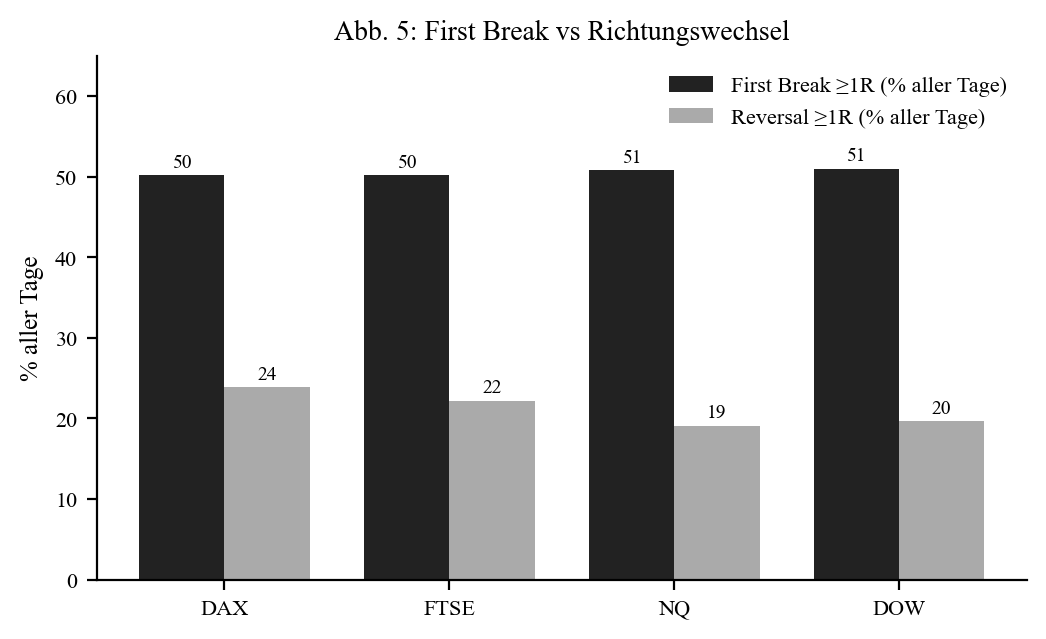
After a failed break the opposite side almost always breaks (~90–97%), but reaches 1R in only 44–51% of cases — 19–24% across all days. The reversal stays the weaker side.
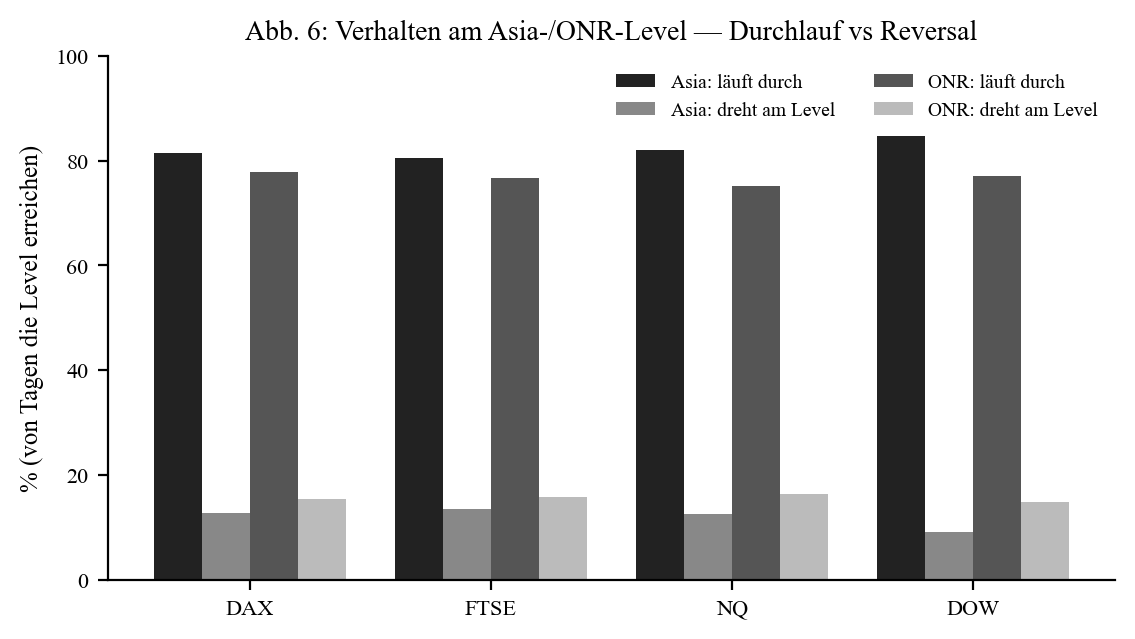
Neither the Asia nor the ONR edge acts as a reversal level: when the trend move reaches the level, it breaks through in ~75–85% of cases. For a trend setup that's even expected — and matches the DAX pre-market study.
Pre-market candle vs. 2nd candle (DAX) — complementary
| Metric | Pre-market candle | 2nd opening candle |
|---|---|---|
| Move logic | to opposing candle/SL | to EOD/SL (trend) |
| Hit ≥ 1R | 56.8% | 50.2% |
| Hit ≥ 5R | 4.3% | 7.2% |
| SL hit rate | 37.2% | 64.9% |
| Break-speed effect | strong | weak |
| Offset effect | lowers hit rate | raises hit rate |
The two setups are complementary: the pre-market candle is an impulse setup (higher hit rate), the 2nd candle a trend setup (fatter tail). Above all the offset effect flips — confirmation hurts the impulse, helps the trend.
Profit factor and spread sensitivity
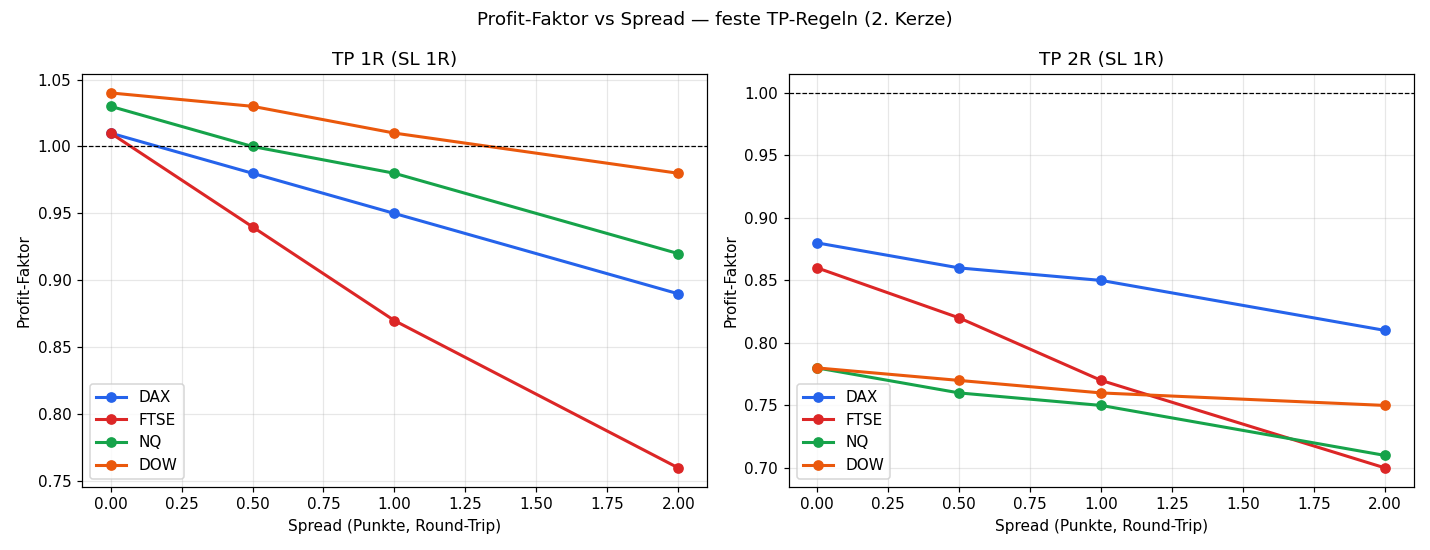
So far only the reach in R was considered — spread-independent. For a tradeable assessment the spread must be included as a fixed point cost. We test a simple fixed-TP rule (take-profit at 1R resp. 2R, stop-loss at 1R) at round-trip spreads of 0 / 0.5 / 1 / 2 points.
Spread as a fraction of R (a fixed spread hits tight markets harder):
| Spread | DAX (R≈38) | FTSE (R≈15) | NQ (R≈48) | Dow (R≈82) |
|---|---|---|---|---|
| 0.5 pt | 1.3% | 3.3% | 1.0% | 0.6% |
| 1.0 pt | 2.6% | 6.6% | 2.1% | 1.2% |
| 2.0 pt | 5.3% | 13.2% | 4.2% | 2.4% |
Profit factor of the fixed TP-1R rule:
| Spread | DAX | FTSE | NQ | Dow |
|---|---|---|---|---|
| 0.0 | 1.01 | 1.01 | 1.03 | 1.04 |
| 0.5 | 0.98 | 0.94 | 1.00 | 1.03 |
| 1.0 | 0.95 | 0.87 | 0.98 | 1.01 |
| 2.0 | 0.89 | 0.76 | 0.92 | 0.98 |
Key finding: the fixed-TP rule is only marginally profitable even at zero spread (PF ~1.0) and clearly drops below with spread — most for the FTSE (small R, spread eats 3–13% of R). TP-2R is consistently worse (PF 0.7–0.9). This is not a contradiction but the logical consequence of the trend nature: fixed take-profits cut exactly the fat tail that carries the expectancy. This setup's value lies not in fixed targets but in letting winners run — exactly the exit-logic study finding. Unlike the pre-market candle (impulse setup, TP-1R PF up to 2.5), the 2nd candle is not suited to fixed TPs.
Characteristics of the 2nd candle: inside bar, colour, ONR position
Does the nature of the 2nd candle itself change the expectancy of the break trade? Three characteristics, tested cross-asset across all four indices, measured on realised net-R (Time-BE-60, net of spread):
Inside bar (2nd candle fully inside the 1st): no adverse effect — contrary to the obvious intuition. Cross-asset +0.13 R (inside) vs +0.11 R (non-inside), mixed per index (NQ/DOW slightly better inside, DAX/FTSE slightly worse). An inside bar is therefore not negative — it just gives a smaller R; the per-R outcome is essentially the same. No usable filter signal.
Colour of the 2nd candle (bullish vs bearish): completely irrelevant. Bullish +0.11 R vs bearish +0.11 R cross-asset — and contradictory per index (DAX likes bullish, DOW bearish). Pure noise.
Close relative to the overnight range (ONR) × break direction: here there is real structure.
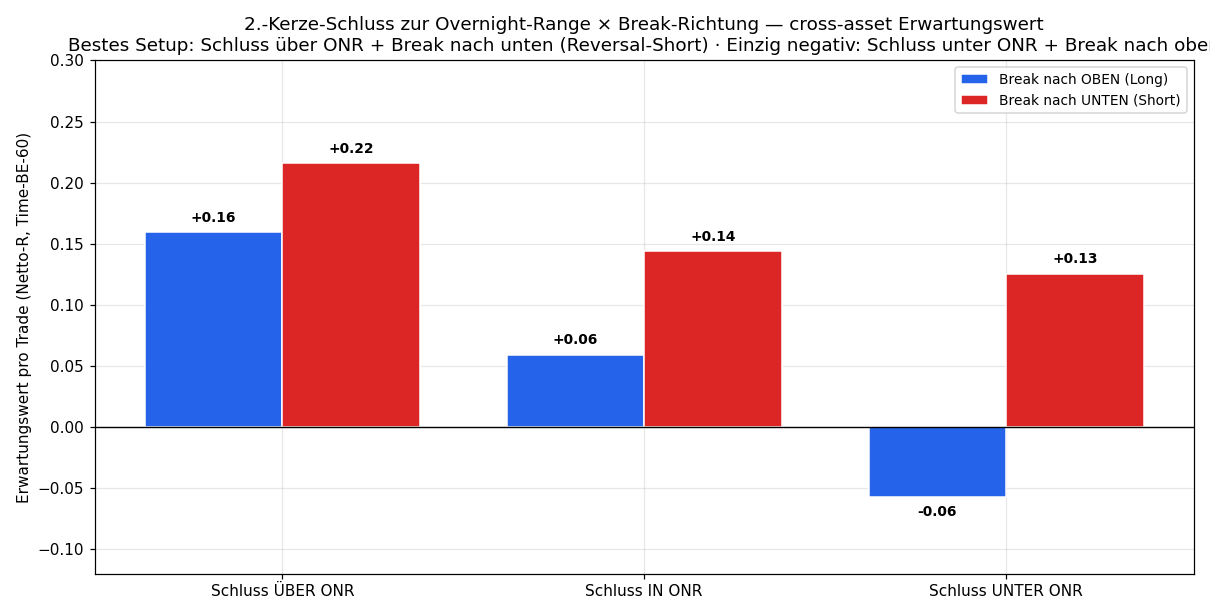
| Close of the 2nd candle | Break ↑ (long) | Break ↓ (short) |
|---|---|---|
| above ONR | +0.16 | +0.22 |
| inside ONR | +0.06 | +0.15 |
| below ONR | −0.07 | +0.13 |
(cross-asset expectancy in net-R per trade)
Key findings:
- Short beats long in every ONR bucket (cross-asset) — confirms the series' short tendency (consistent on NQ/FTSE/DOW; DAX neutral).
- Best setup: close above the ONR, then break down (+0.22 cross; NQ +0.36, DAX +0.34, DOW +0.21) — a reversal short after overnight strength. The strongest, most consistent positive signal.
- Only negative bucket: close below the ONR, then break up (−0.07 cross; NQ/FTSE −0.18) — a long against overnight weakness. Caveat: mildly positive on DAX/DOW, so a tendency, not a hard rule.
Overnight gap (today's open vs yesterday's close) × break direction: the same pattern, even clearer.
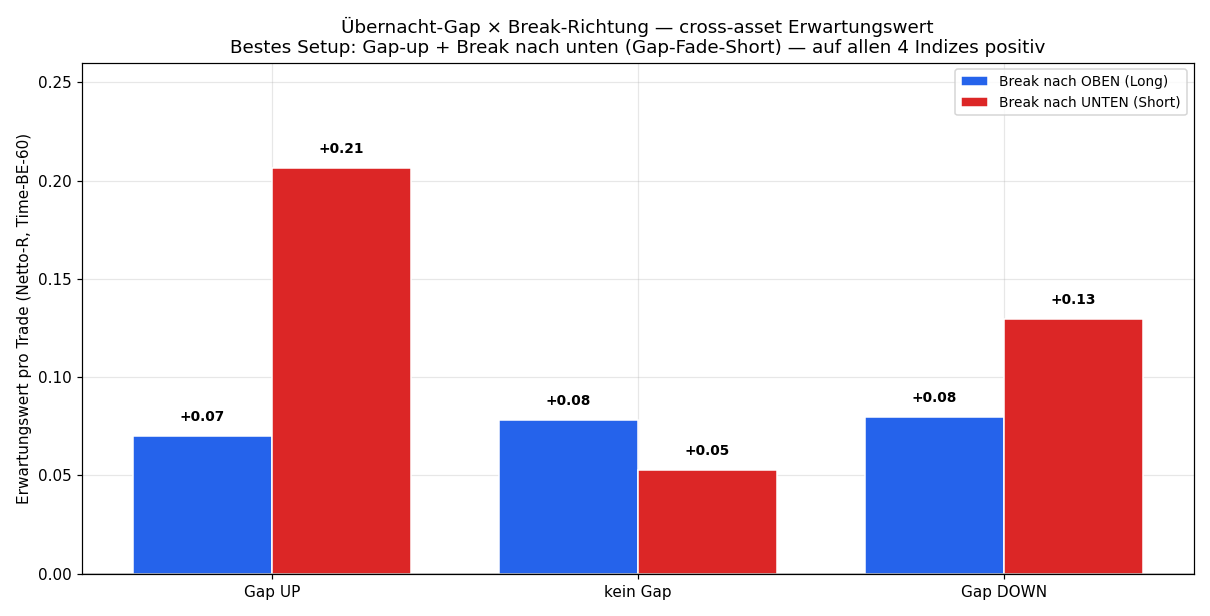
| Break ↑ (long) | Break ↓ (short) | |
|---|---|---|
| Gap up | +0.07 | +0.21 |
| Gap down | +0.08 | +0.13 |
(cross-asset expectancy in net-R per trade)
Key finding: "gap up → break down" (gap-fade short) is the strongest setup (+0.21) — and the only one positive on all four indices (NQ/DOW +0.31, DAX +0.17, FTSE +0.05). Short beats long in both gap regimes. A gap down, by contrast, produces no strong directional edge (both sides ~+0.08…+0.13). This matches the ONR finding exactly: the highest expectancy is in shorting morning strength (close above ONR, or gap up → break down).
Honestly framed: ONR position and gap carry signal (gap-fade short is even 4/4-consistent), but with cross-index variance — and every extra condition is a parameter and thus an overfit risk. How to incorporate such features into an algorithm at all — and why a risk/size adjustment (conviction sizing) is usually more robust than a hard filter — is covered in the methodology. Inside bar and candle colour, by contrast, are clear null results.
Conclusion
The 2nd opening candle is partly a trend breakout — with clear asymmetry: no high hit rate (~50%, stop 57–68%), but fat tails (≥ 3R on 16–19%, ≥ 5R on 5–7%). Whoever endures the many stops catches the few large trend days. Consistent across all four indices.
Limitations: trend logic to EOD/SL (other exits → other numbers); spread is modelled (see spread section), but slippage is not; single-source data; news events/volume not covered.
📄 Full study as PDF · See also: 7th opening candle
Disclaimer: Historical statistics are no guarantee of future market behaviour. Not investment advice. Trading involves risk of loss up to total loss.