Trend-Day Detection via the 7th Opening Candle
Data basis: DAX / FTSE / NQ / Dow M5 + M1, Jan 2018 – Feb 2026, ~2,090 trading days per index. Move logic: to end-of-day or stop-loss (trend tracking). No trading recommendation, no return promise.
This study examines the 7th 15-minute candle after cash open — the quarter-hour roughly 90 minutes into the session, in later morning trading. Where the 2nd candle captures the immediate opening dynamics, the 7th sits in the phase where the actual day trend establishes itself. Same move logic as the 2nd candle (to EOD/SL) → directly comparable.
| Index | 7th candle (local) |
|---|---|
| DAX | 10:30–10:45 |
| FTSE 100 | 09:30–09:45 |
| Nasdaq / Dow | 11:00–11:15 NY |
Range & trend-day distribution
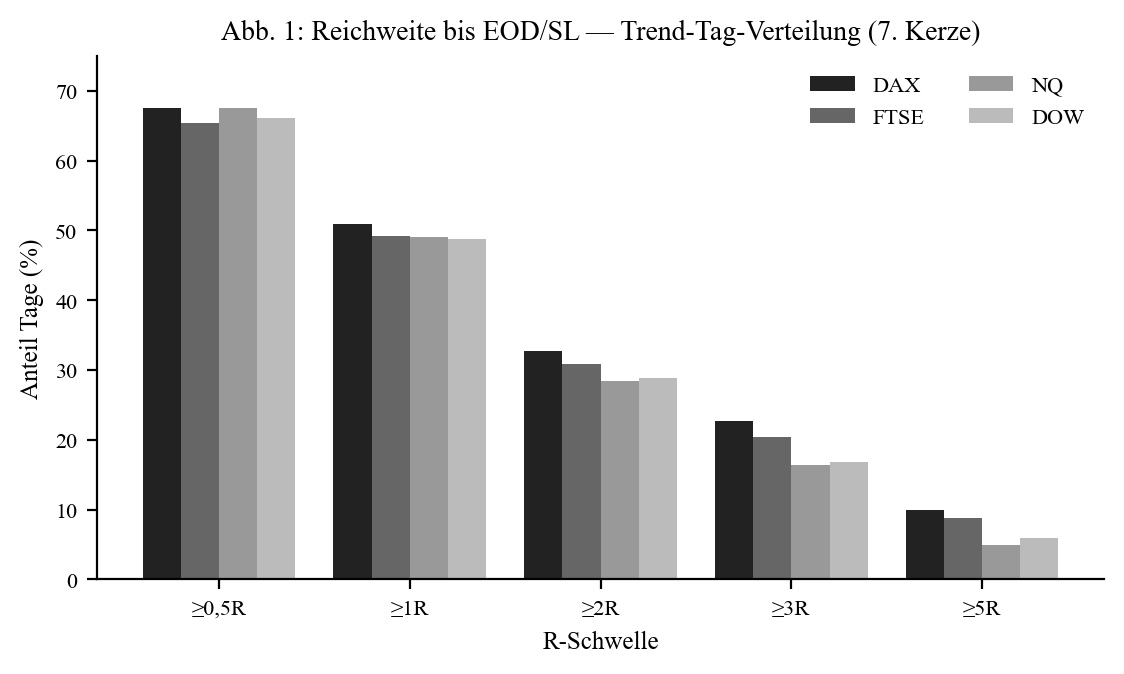
| Index | R-med (pts) | ≥ 1R | ≥ 2R | ≥ 3R | ≥ 5R |
|---|---|---|---|---|---|
| DAX | 26.0 | 50.9% | 32.7% | 22.7% | 9.9% |
| FTSE | 10.5 | 49.2% | 30.8% | 20.4% | 8.8% |
| NQ | 34.5 | 49.0% | 28.4% | 16.4% | 4.9% |
| Dow | 60.6 | 48.7% | 28.9% | 16.8% | 6.0% |
About one day in two reaches ≥ 1R. Genuine trend days (≥ 3R) occur on 16–23%, big trends (≥ 5R) on 5–10%. DAX and FTSE show the fattest tails — even more pronounced for the late 7th candle than for the 2nd.
Stop rate vs. trend tail
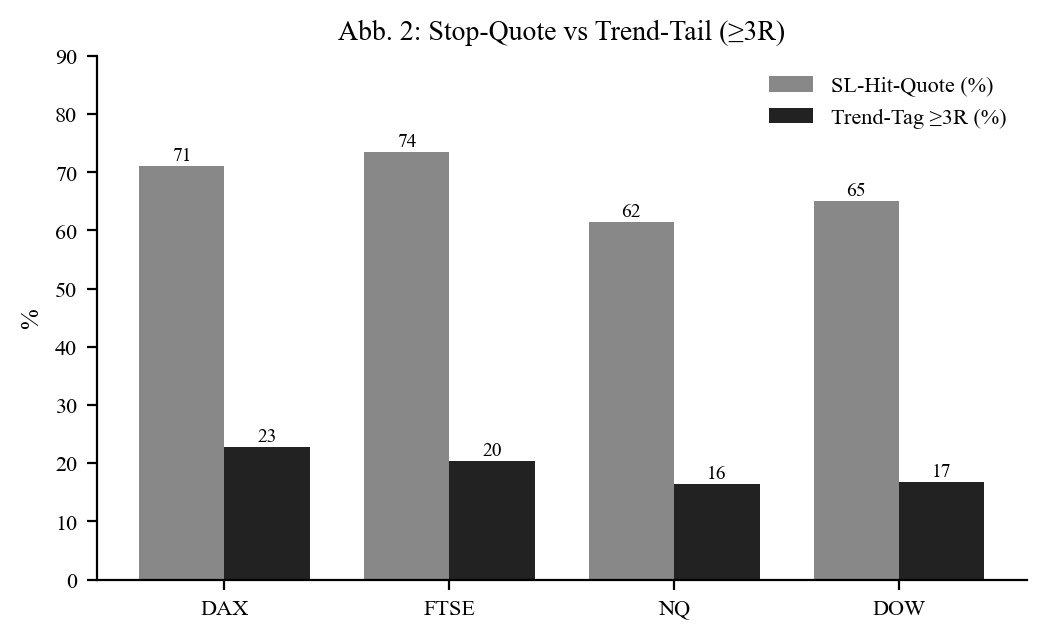
The stop rate sits between 61.5% (NQ) and 73.5% (FTSE) — even higher than for the 2nd candle. Classic trend signature: low hit rate, fat tail.
Timing — irrelevant
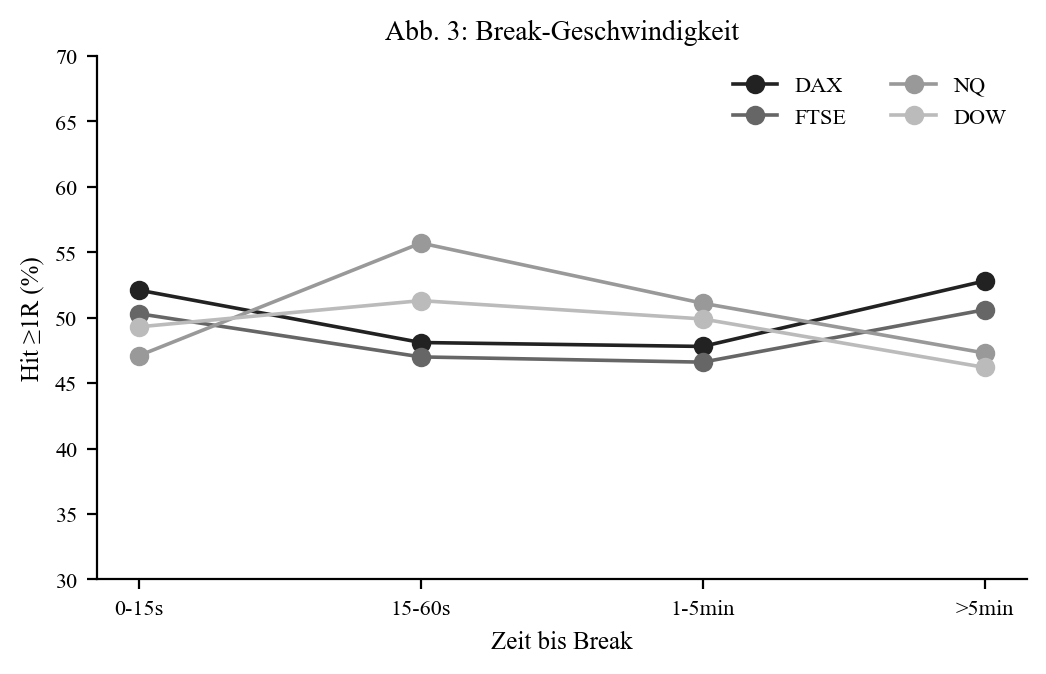
As with the 2nd candle, the hit rate is flat (~50%) across all timing buckets. The break second says nothing about trend success.
Offset — confirmation pays off especially clearly
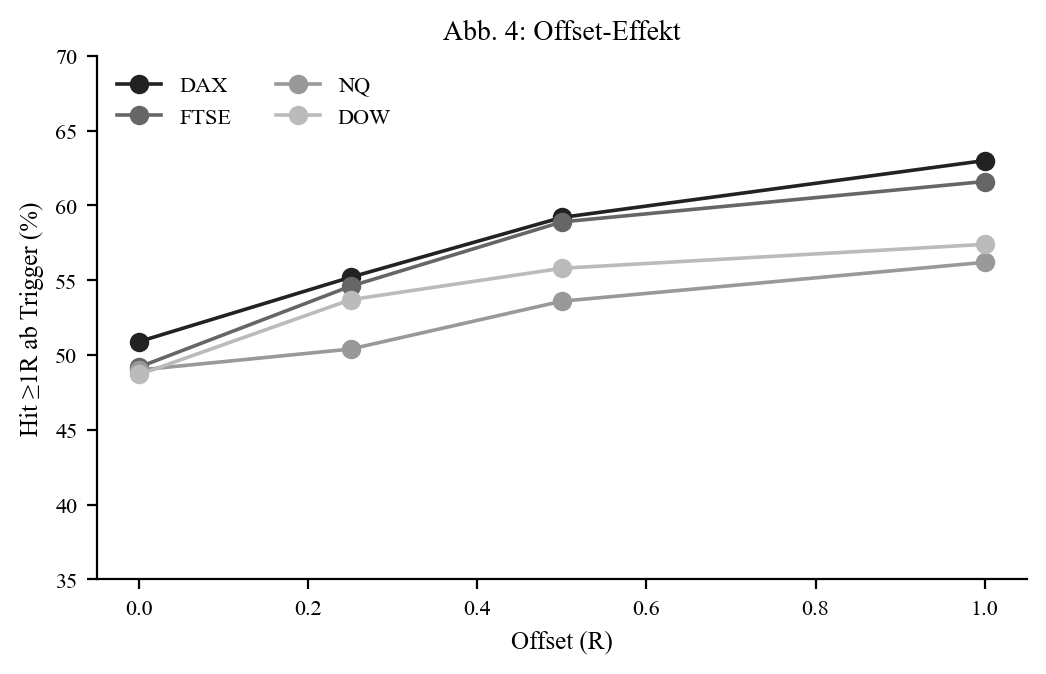
| Index | 0R (immediate) | 0.5R | 1.0R |
|---|---|---|---|
| DAX | 50.9% | 59.2% | 63.0% |
| FTSE | 49.2% | 58.9% | 61.6% |
| NQ | 49.0% | 53.6% | 56.2% |
| Dow | 48.7% | 55.8% | 57.4% |
The offset effect is even stronger here than for the 2nd candle: DAX 50.9% → 63.0% at 1R offset. For the late trend candle, waiting for confirmation pays especially well.
Reversal & Asia/ONR sweep
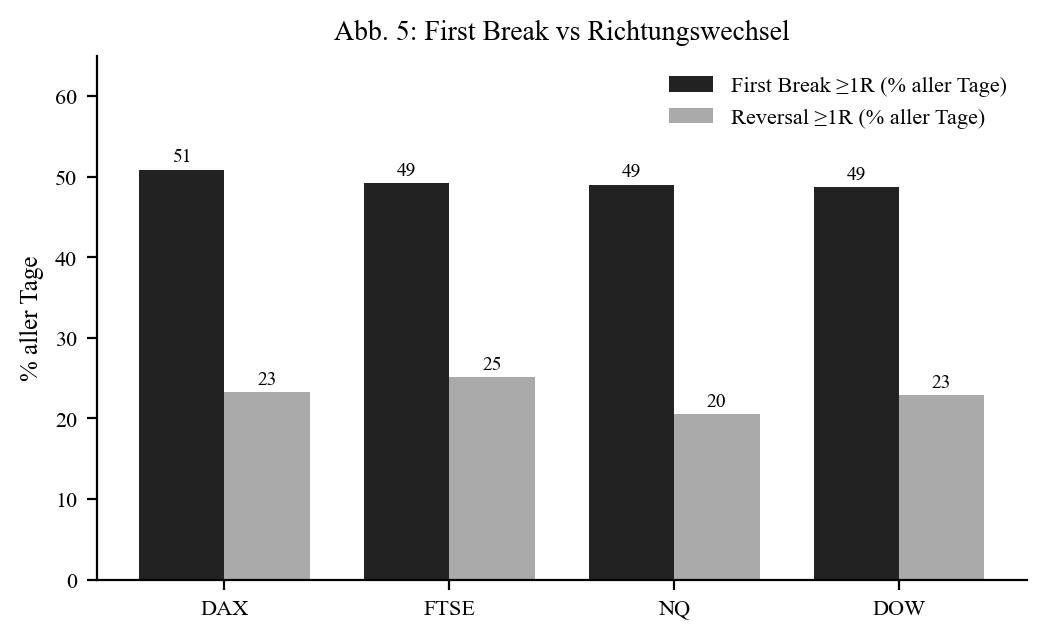
After a failed break the opposite side almost always breaks (~90–98%) but reaches 1R in only 44–50% — 20–25% across all days. The weaker side.
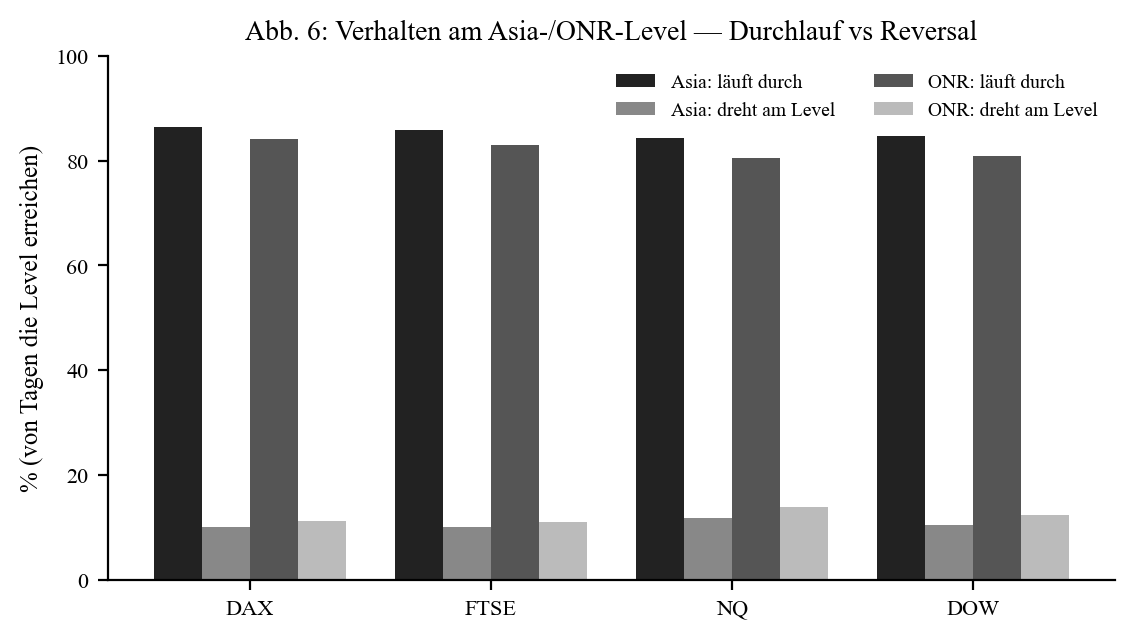
The Asia and ONR edges are broken through by the trend move in ~80–86% of cases — even more clearly for the late 7th candle than the 2nd. Not a reliable reversal level, but typical of a genuine trend setup.
2nd vs. 7th candle (DAX) — same logic, directly comparable
| Metric | 2nd candle (early) | 7th candle (late) |
|---|---|---|
| Hit ≥ 1R | 50.2% | 50.9% |
| Hit ≥ 3R | 19.4% | 22.7% |
| Hit ≥ 5R | 7.2% | 9.9% |
| SL hit rate | 64.9% | 71.0% |
| Offset 0→1R | 50 → 59% | 51 → 63% |
The two candles behave surprisingly similarly (≥ 1R practically equal). The late 7th candle delivers slightly fatter trend tails at a higher stop rate — so the trend asymmetry is a touch more pronounced here. The offset effect works the same for both (confirmation helps).
Profit factor and spread sensitivity
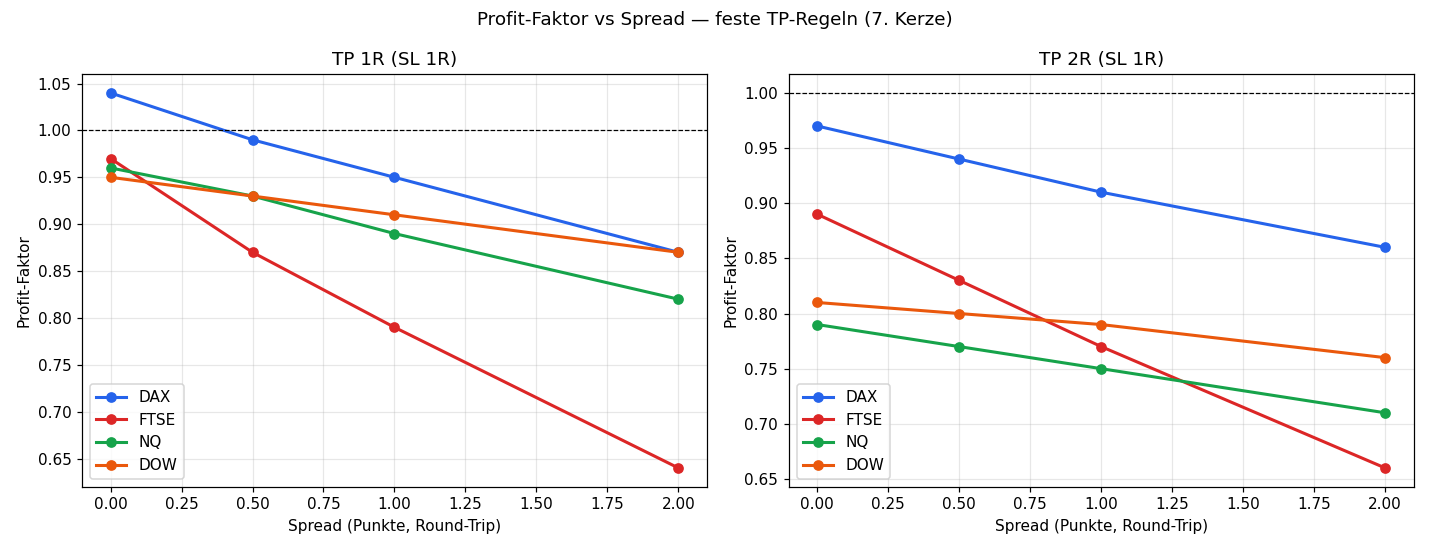
As with the 2nd candle, spread is included as a fixed point cost. We test a fixed TP rule (take-profit at 1R resp. 2R, stop-loss at 1R) at round-trip spreads of 0 / 0.5 / 1 / 2 points. The 7th candle has a smaller R than the 2nd (DAX 26 vs 38 pts) — so the fixed spread hits it harder.
Spread as a fraction of R:
| Spread | DAX (R≈26) | FTSE (R≈10.5) | NQ (R≈34.5) | Dow (R≈61) |
|---|---|---|---|---|
| 0.5 pt | 1.9% | 4.8% | 1.4% | 0.8% |
| 1.0 pt | 3.8% | 9.5% | 2.9% | 1.7% |
| 2.0 pt | 7.7% | 19.0% | 5.8% | 3.3% |
Profit factor of the fixed TP-1R rule:
| Spread | DAX | FTSE | NQ | Dow |
|---|---|---|---|---|
| 0.0 | 1.04 | 0.97 | 0.96 | 0.95 |
| 0.5 | 0.99 | 0.87 | 0.93 | 0.93 |
| 1.0 | 0.95 | 0.79 | 0.89 | 0.91 |
| 2.0 | 0.87 | 0.64 | 0.82 | 0.87 |
Key finding: the picture is even clearer than for the 2nd candle — fixed TPs are already at or below 1.0 at zero spread and break down clearly with spread, the FTSE down to PF 0.64 (small R, spread eats up to 19% of R). TP-2R is consistently worse. Again: fixed take-profits cut the tail that carries the expectancy. The smaller R makes the 7th candle even more spread-sensitive than the 2nd — the edge must come from the tail (letting it run), not from fixed targets.
Conclusion
The 7th opening candle is also partly a trend breakout — with an even clearer asymmetry than the 2nd: ≥ 3R on 16–23%, ≥ 5R on 5–10%, at a stop rate of 62–74%. Consistent across all four indices; DAX/FTSE with the strongest tails. Because of the smaller R it is more spread-sensitive — fixed TPs do not survive the spread.
Limitations: trend logic to EOD/SL; only the 7th candle tested (other late candles not); spread is modelled (see spread section), but slippage is not; single-source data; news events not covered.
📄 Full study as PDF · See also: 2nd opening candle
Disclaimer: Historical statistics are no guarantee of future market behaviour. Not investment advice. Trading involves risk of loss up to total loss.