Phase 3 — The Validation Gate: Does the 2nd-Candle Edge Survive Out-of-Sample, Walk-Forward & Monte-Carlo?
Data basis: DAX / FTSE / NQ / Dow M5 + M1, Jan 2018 – Feb 2026, ~2,090 trading days per index. Ruleset: 2nd-candle break + Time-BE-60 exit (from the exit study), fixed, no in-sample optimisation, net of spread (1 pt + slippage). No trading recommendation.
In the algo pipeline this is Phase 3 — the validation gate. Entry, exit and filters were fixed in the exit-logic study (Phase 2). Now only one question counts: does the edge survive on data that did not contribute to the selection? Tested with four independent methods — out-of-sample, walk-forward, Monte-Carlo, deflated Sharpe. Because the ruleset is fixed (no parameter optimised in-sample), these tests are clean.
The strict gate requires four conditions simultaneously: (1) OOS PF ≥ 1.3, (2) ≥ 80% profitable walk-forward windows, (3) recovery ratio ≥ 2 (total-R / 95% shuffle-MaxDD), (4) bootstrap P(profitable) > 95%.
Why Time-BE-60 and not Time-BE-30? In the exit study (Phase 2) the total-R optimum was at ~30 min. Here we deliberately validate the more conservative BE-60: a later break-even intervenes less often, sits closer to the raw entry edge and preserves less of an in-sample optimum. BE-30 yields higher total-R but sits nearer the fitted peak — the stricter test demands the more robust variant, not the most profitable one.
1. Out-of-sample (locked data)
In-sample = 2018–2022, out-of-sample = 2023–2026 (never used for rule selection).
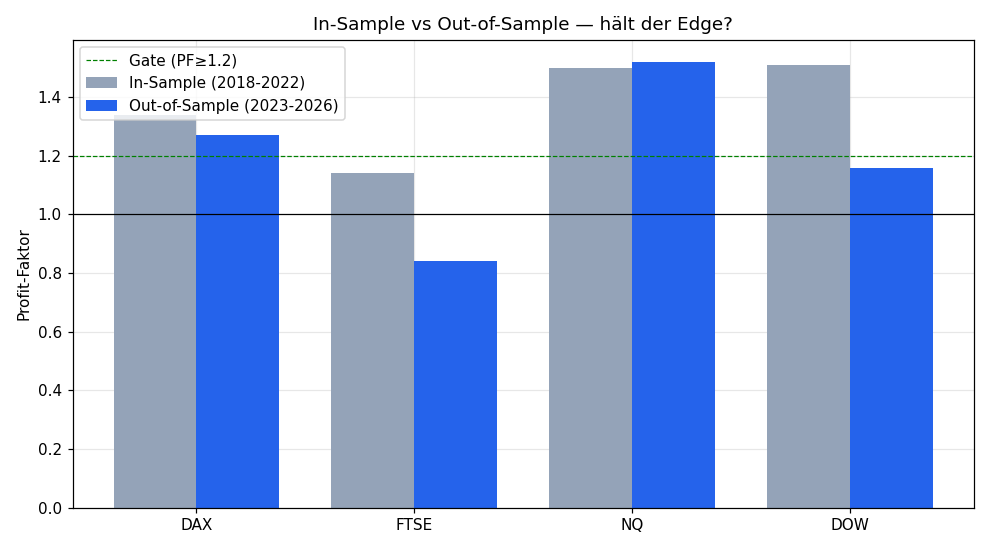
| Index | IS PF (18–22) | OOS PF (23–26) | Years profitable |
|---|---|---|---|
| NQ | 1.50 | 1.52 | 9/9 |
| DAX | 1.50 | 1.27 | 8/9 |
| DOW | 1.51 | 1.16 | 7/9 |
| FTSE | 1.50 | 0.84 | 5/9 |
In in-sample all four looked identical (PF ~1.50). Out-of-sample separates the wheat: NQ holds (1.52), DAX weakens (1.27), FTSE collapses to 0.84. The in-sample PF alone is worthless.
2. Walk-forward (rolling)
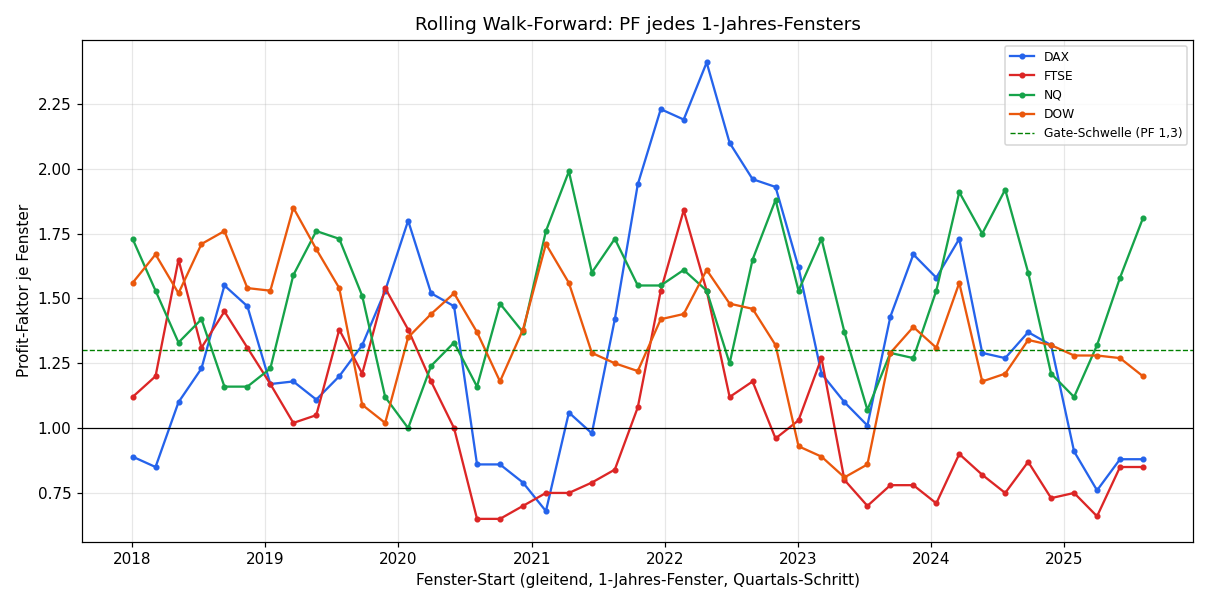
45 rolling 1-year windows (quarter step). Each window is its own mini-OOS test of the fixed ruleset.
| Index | Windows | Profitable | Median PF | Min PF | Max PF |
|---|---|---|---|---|---|
| NQ | 45 | 100% | 1.53 | 1.00 | 1.99 |
| DOW | 45 | 91% | 1.37 | 0.81 | 1.85 |
| DAX | 45 | 76% | 1.29 | 0.68 | 2.41 |
| FTSE | 45 | 49% | 1.00 | 0.65 | 1.84 |
NQ passes in 100% of all 45 windows (even the worst still PF 1.00). DOW 91%, DAX only 76% (< 80% → gate missed), FTSE essentially a coin flip (49%).
3. Walk-forward (anchored)
Cumulative PF in an expanding window — shows whether the edge degrades over time.
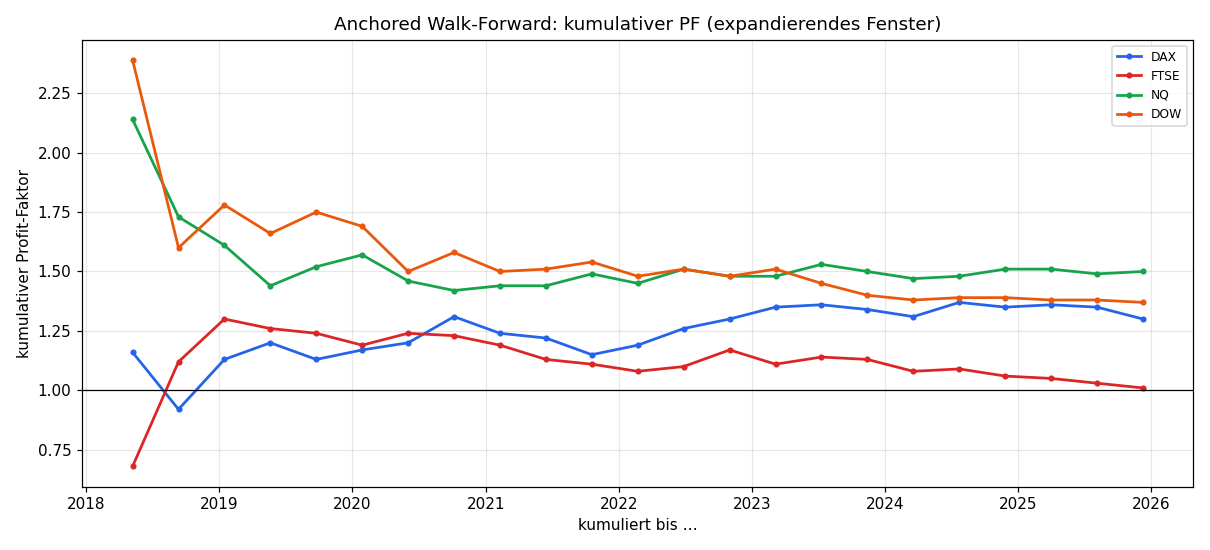
NQ and DOW start high (cum. PF 2.1–2.4 in the early years) and converge to 1.50 / 1.37 — the edge weakens but stays stable above 1.3 for NQ. DAX settles at 1.30, FTSE crawls from 0.68 to only 1.01 — no viable edge.
4. Monte-Carlo (shuffle + bootstrap)
Two methods with different meaning:
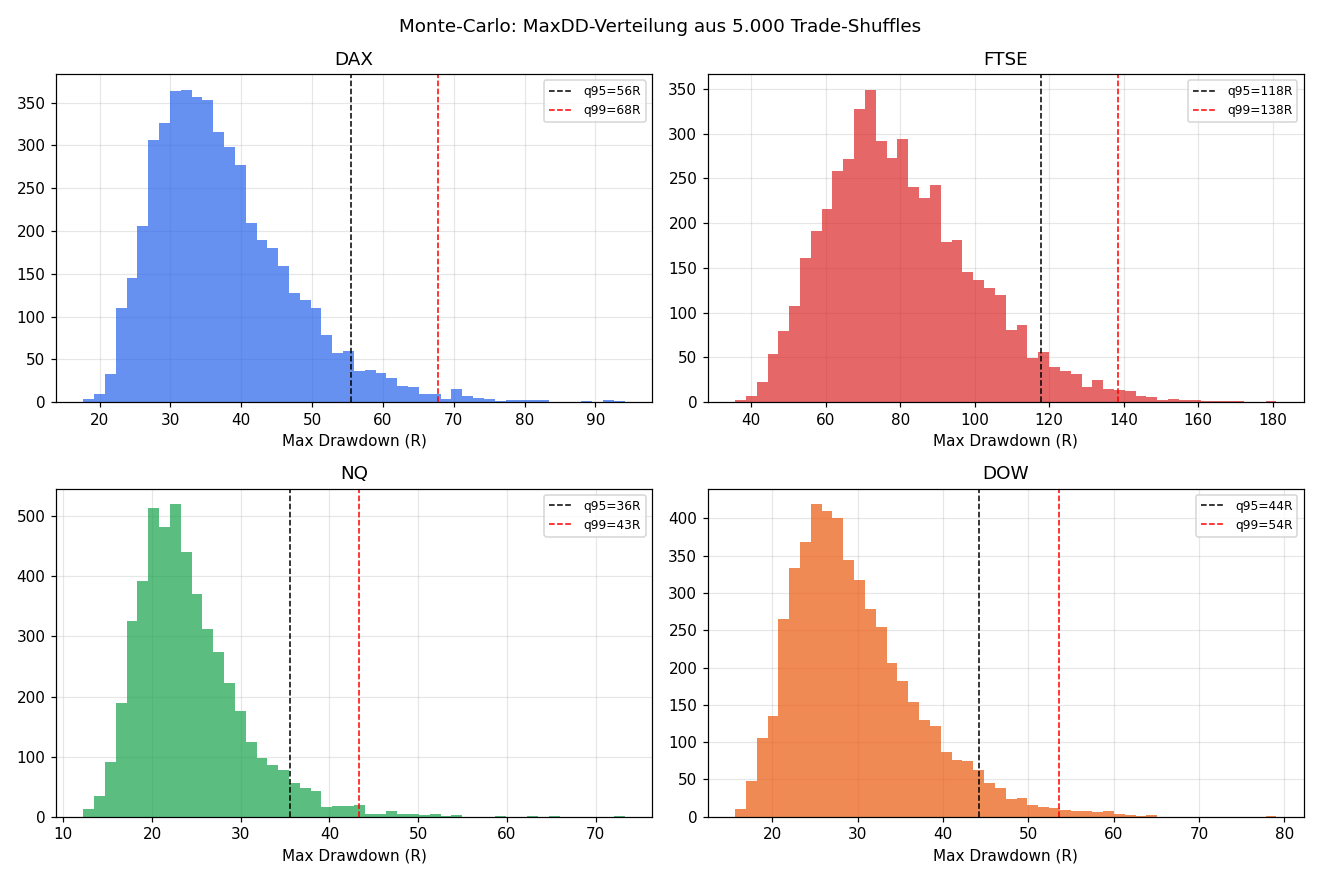
- Shuffle (5,000 permutations): varies the order → how bad can the drawdown get purely from ordering bad luck? (The total sum is order-invariant — a shuffle alone therefore always gives P=100%.)
- Bootstrap (5,000 draws with replacement): varies the sample → distribution of the total result and true P(profitable).
| Index | Shuffle MaxDD q95 | Bootstrap total q05 | Bootstrap median | P(profitable) |
|---|---|---|---|---|
| NQ | 35 R | +263 R | +381 R | 100% |
| DOW | 44 R | +159 R | +275 R | 100% |
| DAX | 56 R | +106 R | +237 R | 99.9% |
| FTSE | 118 R | −112 R | +13 R | 56.5% |
The decisive value is the bootstrap P(profitable): NQ/DOW 100%, DAX 99.9% — robust edges. FTSE only 56.5% (coin flip) and a 5% quantile of −112 R — no tradeable edge.
5. Deflated Sharpe (multiple testing)
The exit was selected from 37 variants in-sample — that inflates any best value. The deflated Sharpe (Bailey/López de Prado) corrects for this. Under this strict bar the per-trade Sharpe does not clear the significance threshold — an honest caution: the high in-sample PF is partly a selection effect. The robust evidence is not the backtest PF but the OOS persistence + walk-forward consistency above.
6. Gate verdict
| Index | OOS PF≥1.3 | WF prof≥80% | Recovery≥2 | Bootstrap P>95% | GATE |
|---|---|---|---|---|---|
| NQ | ✓ 1.52 | ✓ 100% | ✓ 10.8 | ✓ 100% | ✅ PASSES |
| DAX | ✗ 1.27 | ✗ 76% | ✓ 4.2 | ✓ 99.9% | ❌ just fails |
| DOW | ✗ 1.16 | ✓ 91% | ✓ 6.3 | ✓ 100% | ❌ fails (PF) |
| FTSE | ✗ 0.84 | ✗ 49% | ✗ 0.1 | ✗ 56.5% | ❌ clearly fails |
Only NQ passes all four criteria. DAX is borderline (fails only the 1.3 bar and 80% WF), DOW fails on OOS PF, FTSE fails across the board.
7. Exit robustness: is the edge in the entry or the exit?
A single validated exit does not answer the decisive question: is the edge a property of the entry (2nd-candle break) — or just luck with this one exit? So the same gate (OOS + walk-forward + Monte-Carlo) runs on three structurally different exits: BE-60 (pure risk management), ONR-edge + BE60 and Asia-edge + BE60 (two level take-profits). This is not a re-selection — BE-60 stays the main system — but a declared stress test with a fixed trial count.
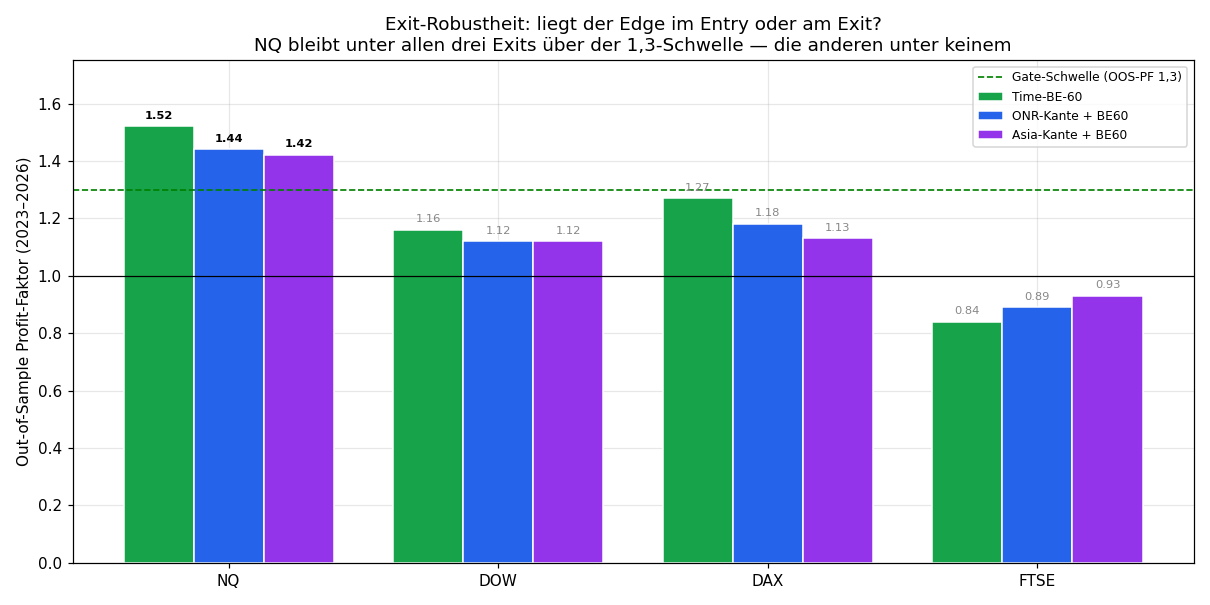
| Index | BE-60 | ONR-edge + BE60 | Asia-edge + BE60 | Gate passes |
|---|---|---|---|---|
| NQ | 1.52 ✓ | 1.44 ✓ | 1.42 ✓ | 3/3 |
| DOW | 1.16 | 1.12 | 1.12 | 0/3 |
| DAX | 1.27 | 1.18 | 1.13 | 0/3 |
| FTSE | 0.84 | 0.89 | 0.93 | 0/3 |
(OOS PF 2023–2026; ✓ = passes the full four-criteria gate)
Finding: NQ passes the complete gate under all three exits (OOS PF 1.42–1.52). This is the real proof — the edge survives a full swap of the exit mechanism and therefore sits in the entry, not in one specific exit rule. DAX, DOW and FTSE fail under every one of the three exits — no exit rescues an entry without an edge. This rules out that NQ's result is a BE-60 artifact.
Conclusion
- The in-sample PF lies — all four looked identical in-sample (1.50), only NQ survived every OOS test.
- Four independent tests agree: OOS, walk-forward and bootstrap Monte-Carlo all show the same ranking NQ > DOW ≈ DAX > FTSE.
- Only NQ passes the strict gate. DAX is borderline tradeable, FTSE is out.
- The edge is exit-robust. NQ passes the gate under three structurally different exits — the edge sits in the entry, not in one specific exit rule.
Only on this validated core does Phase 4 (position sizing/Kelly) follow → Position sizing & Kelly. The only truly clean final test remains the live forward test, since the OOS block stems from the same dataset (2018–2026).
Limitations: spread modelled (1 pt), slippage estimated — real only in forward testing. OOS from the same overall dataset; true OOS = live from today. Deflated Sharpe assumption-sensitive. Single-source data (Dukascopy). News events not covered.
📄 Full study as PDF · Part of the series: 2nd opening candle · Exit logic (Phase 2) · Position sizing (Phase 4)
Disclaimer: Historical statistics are no guarantee of future market behaviour. Not investment advice. Trading involves risk of loss up to total loss.